Measuring procedure for stylus-type surface roughness instruments
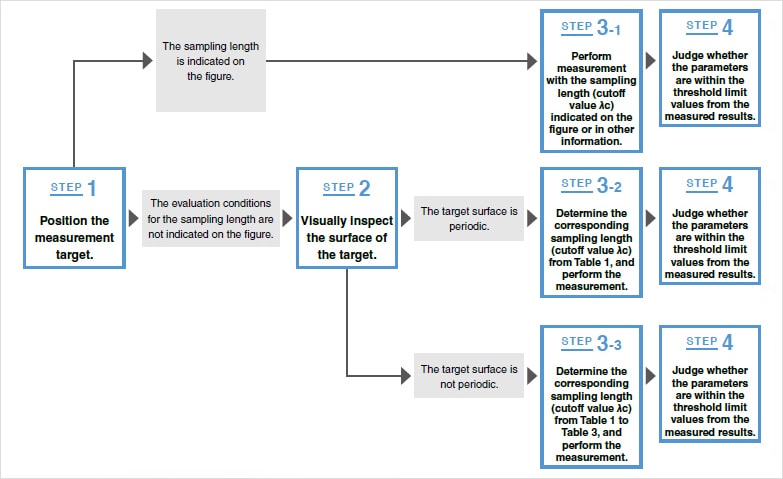
The procedure to measure surface roughness with a stylus-type surface roughness measuring instrument is shown below (this is an excerpt from IOS 4288:1996).

STEP1 Position the measurement target.
Remove any oil or dust on the measurement target's surface.
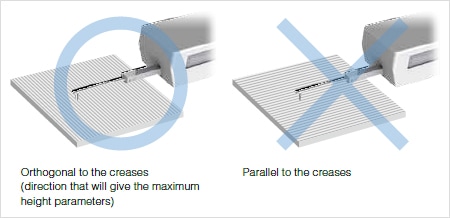
If the measurement direction is not indicated, position the target so that the measurement direction will give the maximum parameters in the height direction (Ra, Rz).

STEP2 Visually inspect the surface of the target.
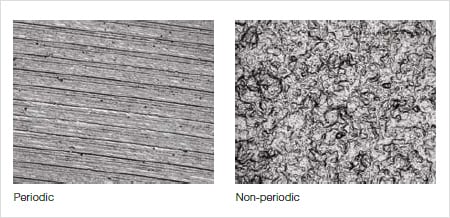
Judge whether the surface texture of the target (creases, roughness profile) is periodic or non-periodic.

STEP3-1 When the sampling length is represented pictorially
When the sampling length is indicated on the figure or in the requirements of the product’s technical information, set the cutoff value, λc, to the indicated sampling length.
STEP3-2 When the roughness profile is periodic
1. For target surfaces that have a periodic roughness profile, estimate parameter RSm from the measured primary profile.
2. Determine the corresponding sampling length (cutoff value λc) from Table 1 by using the estimated RSm.
| RSm(mm inch) | Sampling length of the roughness profile (mm inch) |
Evaluation length of the roughness profile (mm inch) |
|---|---|---|
| 0.013 < RSm ≤ 0.04 | 0.08 | 0.4 0.02" |
| 0.04 < RSm ≤ 0.13 0.01" | 0.25 0.01" | 1.25 0.05" |
| 0.13 0.01" < RSm ≤ 0.4 0.02" | 0.8 0.03" | 4 0.16" |
| 0.4 0.02" < RSm ≤ 1.3 0.05" | 2.5 0.1" | 12.5 0.49" |
| 1.3 0.05" < RSm ≤ 4 0.16" | 8 0.31" | 40 1.57" |
Table 1. Sampling lengths for measurement of the parameters of periodic roughness profiles and for measurement of the RSm of periodic/non-periodic profile curves
3. Use the determined sampling length to measure the RSm value.
4. When the measured RSm is within the RSm range estimated from Table 1, use the cutoff value. When the measured result is outside the estimated RSm range, change the cutoff value to the sampling length of the corresponding RSm.
5. Use the sampling length that you have determined with the steps up to this point to measure the required parameters.
STEP3-3 When the roughness profile is not periodic
1. For target surfaces that have a non-periodic roughness profile, estimate the unknown parameter Ra, Rz, or RSm from the measured primary profile.
2. Determine the corresponding sampling length (cutoff value λc) from Table 1 to Table 3 by using the estimated unknown parameter Ra, Rz, or RSm.
| Ra (μm Mil) | Sampling length of the roughness profile (mm inch) |
Evaluation length of the roughness profile (mm inch) |
|---|---|---|
| (0.006) < Ra ≤ 0.02 | 0.08 | 0.4 0.02" |
| 0.02 < Ra ≤ 0.1 0.004 Mil | 0.25 0.01" | 1.25 0.05" |
| 0.1 < Ra ≤ 2 0.004 Mil < Ra ≤ 0.079 Mil | 0.8 0.03" | 4 0.16" |
| 2 < Ra ≤ 10 0.079 Mil < Ra ≤ 0.39 Mil | 2.5 0.1" | 12.5 0.49" |
| 10 < Ra ≤ 80 0.39 Mil < Ra ≤ 3.15 Mil | 8 0.31" | 40 1.57" |
Table 2. Roughness parameters Ra, Rq, Rsk, Rku, and R⊿q of non-periodic profile curves, load curve BAC, probability density function ADF, and the sampling length of the related parameters
| Rz (μm Mil) | Sampling length of the roughness profile (mm inch) |
Evaluation length of the roughness profile (mm inch) |
|---|---|---|
| (0.025) < Rz ≤ 0.1 0.004 Mil | 0.08 | 0.4 0.02" |
| 0.1 < Rz ≤ 0.5 0.004 Mil < Rz ≤ 0.02 Mil | 0.25 0.01" | 1.25 0.05" |
| 0.5 < Rz ≤ 10 0.02 Mil < Rz ≤ 0.39 Mil | 0.8 0.03" | 4 0.16" |
| 10 < Rz ≤ 50 0.39 Mil < Rz ≤ 1.97 Mil | 2.5 0.1" | 12.5 0.49" |
| 50 < Rz ≤ 200 1.97 Mil < Rz ≤ 7.87 Mil | 8 0.31" | 40 1.57" |
Table 3. Sampling length for the roughness parameters Rz, Rv, Rc, and Rt of non-periodic profile curves
3. Use the determined sampling length to measure the values of the roughness parameters.
4. When the measured result is within the estimated Ra or Rz range from Table 1 to Table 3, use the cutoff value. When the measured result is outside the estimated Ra or Rz range, change the cutoff value to the sampling length of the range corresponding to the measured Ra or Rz.
5. Use the sampling length that you have determined with the steps to this point to measure the required parameters.
STEP4 Judge whether the parameters are within the threshold limit values from the measured results.
Use the visual inspection from step 2 to determine whether the target’s surface texture is uniform (periodic) or is different in various locations (non-periodic).
Case.1 The target’s surface texture is uniform.
Compare the parameters measured from the entirety of the target surface against the required values indicated on the figure or in the product’s technical information. Then, judge whether the parameters are within the permissible ranges according to the 16% rule or the maximum value rule.
Case.2 The target’s surface texture is different in various locations.
Compare the parameters determined from various locations on the target against the required values indicated on the figure or in the product’s technical information. Then, judge whether the parameters are within the permissible ranges according to the 16% rule or the maximum value rule.
| 16% rule |
|---|
|
When the required values are indicated as the upper limits of the parameters, measure the location that has the maximum parameters in the height direction (Ra, Rz) as judged by a visual inspection. Those parameters calculated from the entire sampling length cut from the obtained roughness profile (one evaluation length) that exceed the required values by 16% or less are judged as passing. |
| Maximum value rule |
|---|
| When the required value indicated on the figure or in the product’s technical information is the maximum value, all the parameter values determined from the whole area of the target surface pass if they are less than or equal to the required value. |

