Basic Ideal
We recognize that global climate change prevention and environmental preservation are of paramount importance to our planet, and we consistently act with consideration toward the preservation and improvement of the global environment in all areas of our corporate activities.
Environmental Policy
Based on the following policy, we are making efforts to reduce our environmental impact through the development, manufacture, and sales of automatic control equipment, measurement equipment, information equipment and related electronic application equipment, optoelectronic equipment, and systems for these.
- We will make an effort to protect the environment by complying with environmental laws and regulations, as well as other requirements recognized by the company, and by establishing voluntary management standards.
- To reduce our environmental impact, we will establish and maintain an environmental management system, make continuous improvements, and promote the prevention of environmental pollution.
-
We will focus our efforts on the following environmental impact items related to our activities, products, and services.
- Establish and maintain a chemical substance management system that includes eliminating and preventing the use of harmful chemical substances in consideration of globalization.
- Establish and promote a system for the management of electricity consumption, in order to curb/reduce our carbon footprint.
- Promote efforts to reduce waste, save energy, and recycle to make more effective use of resources.
- Promote the design and development of products that are mindful of environmental burden reduction activities on the part of our customers.
- Promote activities that are mindful of biodiversity.

Environmental Management System
We have constructed and are operating an environmental management system in accordance with the ISO 14001 international standard for environmental management. By doing so, we are promoting sustainable improvement of our environmental conservation measures such as a reduction of our environmental impact. Under the leadership of the president, who is responsible for our company-wide environmental management system, the environmental departments, in coordination with other relevant parties such as the various divisions of KEYENCE and our trading partners, are proactively striving to achieve our environmental goals, by means such as setting environmental tasks from product planning to development, production, shipping, and repair.
Internal Environmental Audits
We have established an environmental management system, overseen by the president, in accordance with the ISO 14001 international standard. In addition to periodic audits by ISO certification bodies, we also implement regular internal audits. This is done to confirm that the environmental management system is maintained effectively and is in compliance with the relevant laws, as well as to implement continuous improvements to the management system and our environmental performance.
Reducing Our Environmental Impact Through Our Products
Contributing to Global Environmental Conservation
KEYENCE contributes to the environment not only by creating products with the environment in mind, but also by reducing environmental impact at locations where customers use our products, as well as in society as a whole where our customers use these products and services. That is what KEYENCE means when we say environmental contribution. We create high-added-value products with a minimal input of energy and resources, contributing to improved productivity and reduced environmental impact at manufacturing sites. Our constant pursuit of greater added value will lead to environmental contributions.
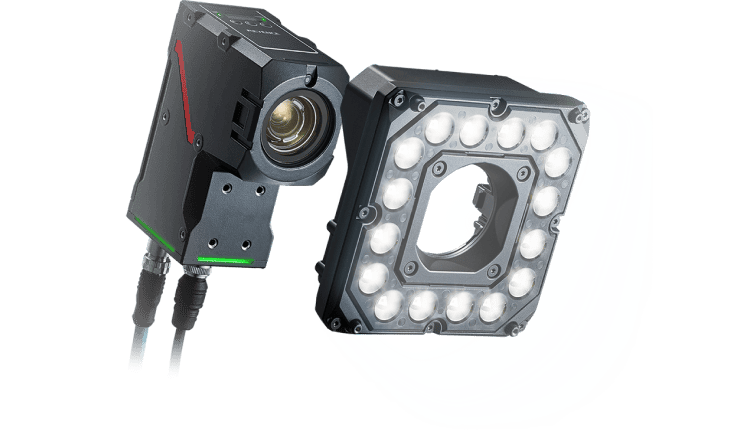
Vision System with Built-in AI
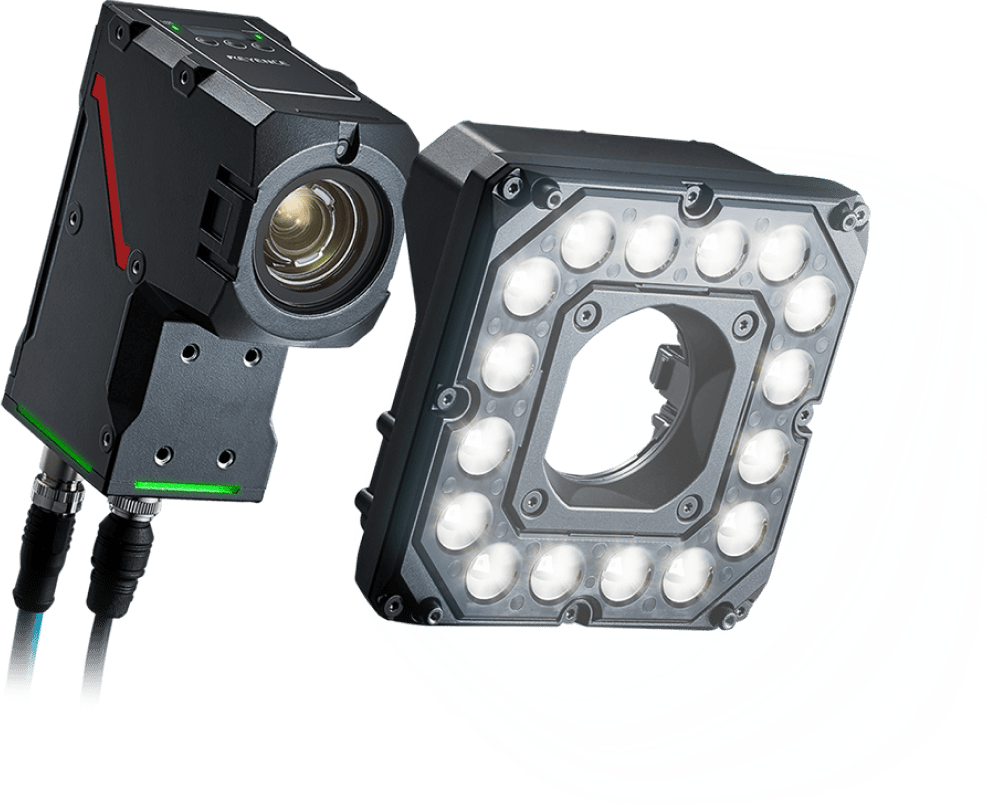
KEYENCE’s Environmental Contribution
Climate change measures
- Reducing our carbon footprint and saving energy
Global environmental protection
- Reducing hazardous substances and achieving zero emissions
- Environmental contributions using our products
- Reducing our environmental impact during manufacturing
Further contribute to reducing costs and improving profit for customers
Developing Products with Low Environmental Impact
Smaller
Reduction of parts used
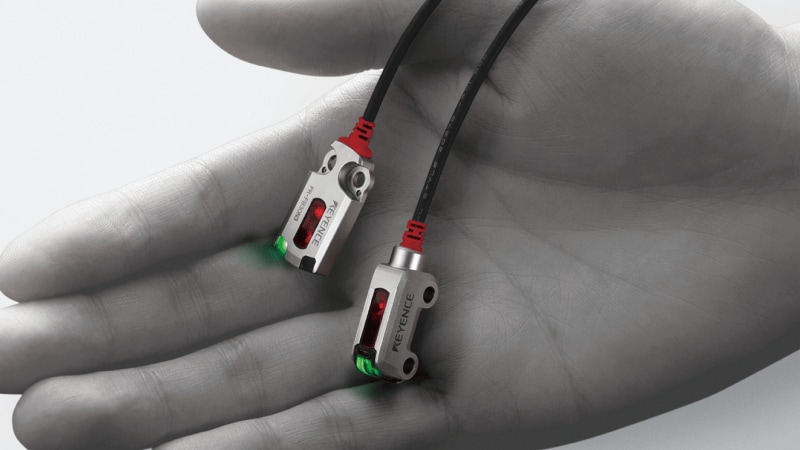
Photoelectric Sensor PR Series
By using our own hybrid construction, we have increased shock resistance by five times while reducing the size by 81% over conventional models.
The result is a photoelectric sensor that is the smallest in its class with significantly improved sensor functionality.
Stronger
Using longer lasting materials
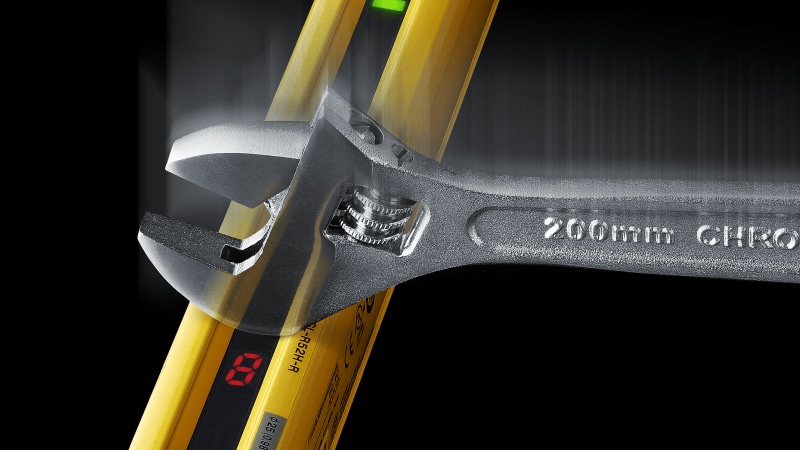
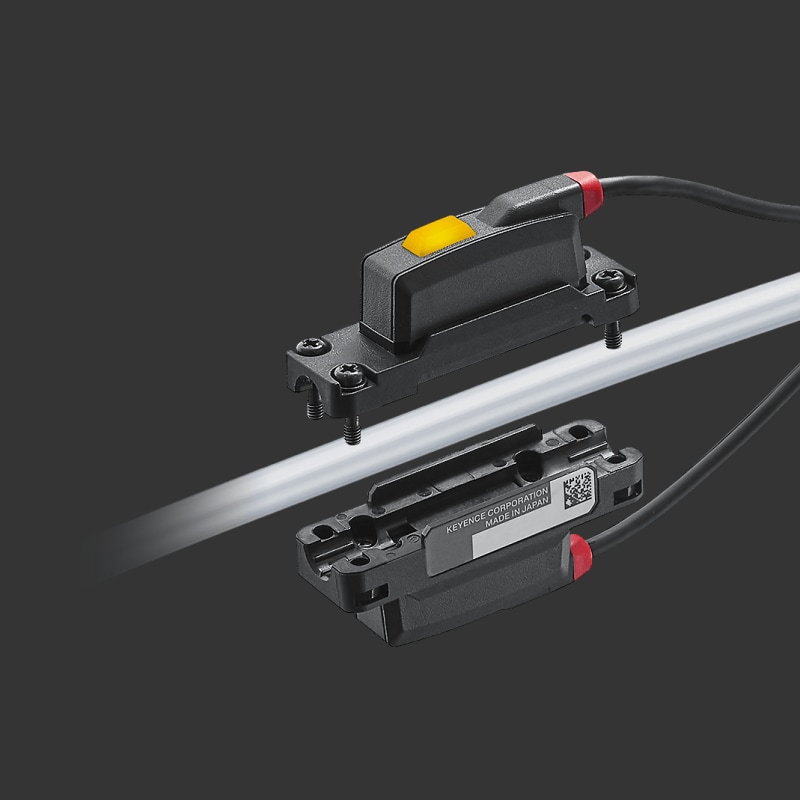
Safety Light Curtain GL-R Series
Despite the compact size, the GL-R Series is designed to be the most robust in the industry. When it comes to light curtains, the most common problem is damage to the optical surface. The twin bumpers on this device have an optimal depth and width to protect the optical surface.
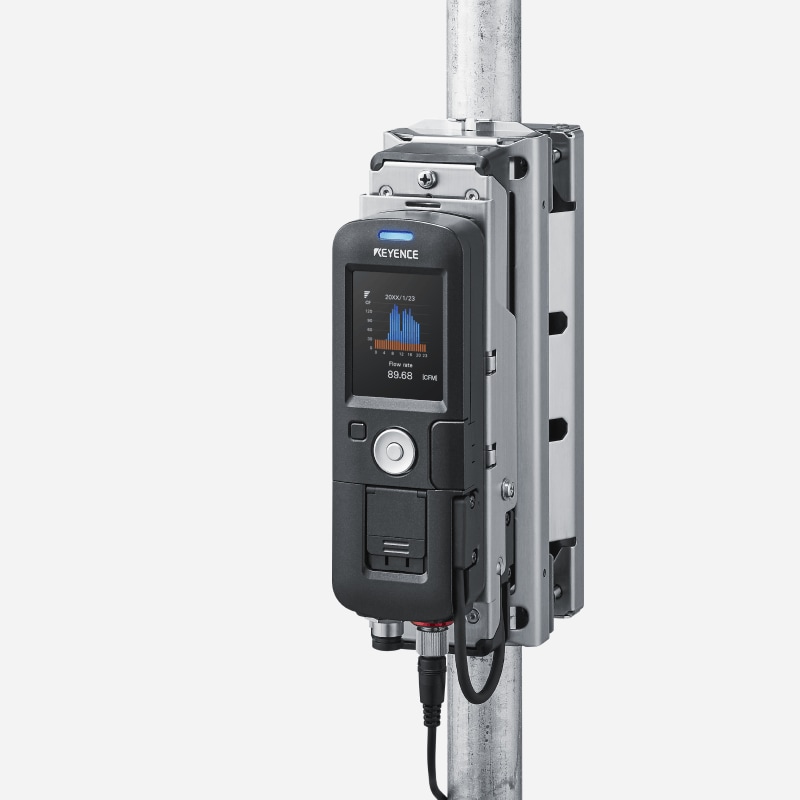
More efficient
Using less energy

Handheld Mobile Computer BT Series
Using a battery degradation control algorithm extends battery life.
The battery degradation control algorithm improves battery life drastically, resulting in less-frequent battery replacement.
Products That Assist in Efforts Toward the Reduction of CO2
We are contributing to CO2 reduction activities through our products.
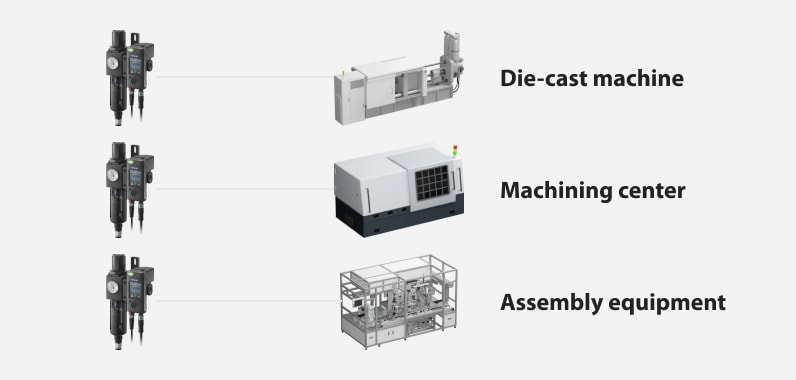
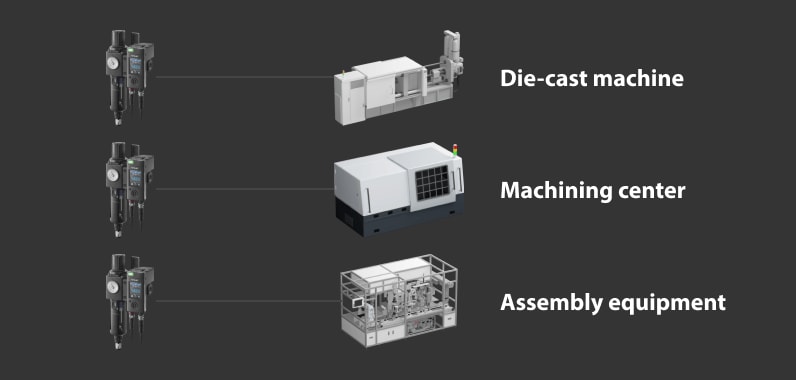
From entire facilities to individual devices:
Easy monitoring of energy usage to achieve energy savings throughout factories
Gas flow meter that requires no pipe modification
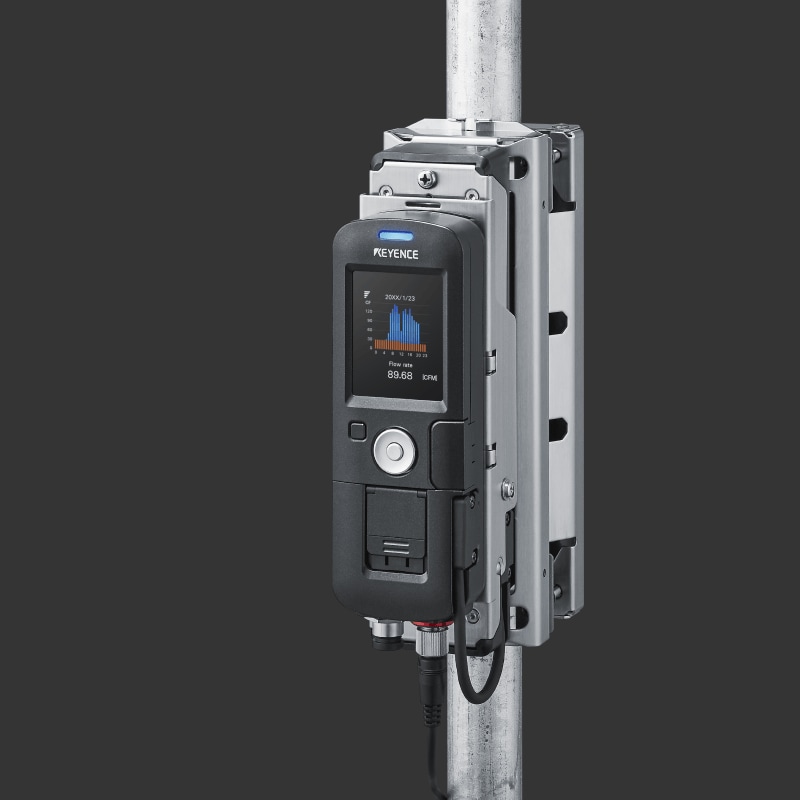
Clamp-on Gas Flow Meter
FD-G Series
- Flow rate
Visualizing leaks in factory pipes
Easy clamp-on installation on pipe sizes up to 200A
-
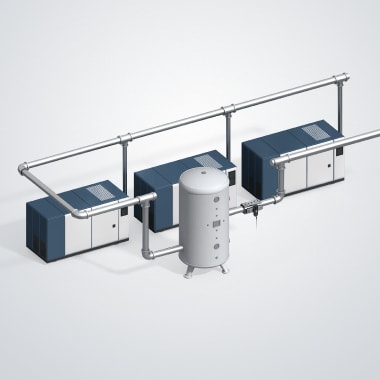
Total amount of compressed air used
-
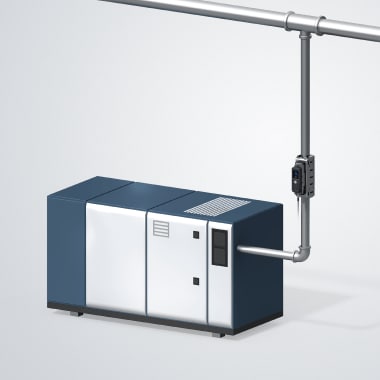
Compressor discharge amount
Visualizing equipment energy consumption to reduce energy use
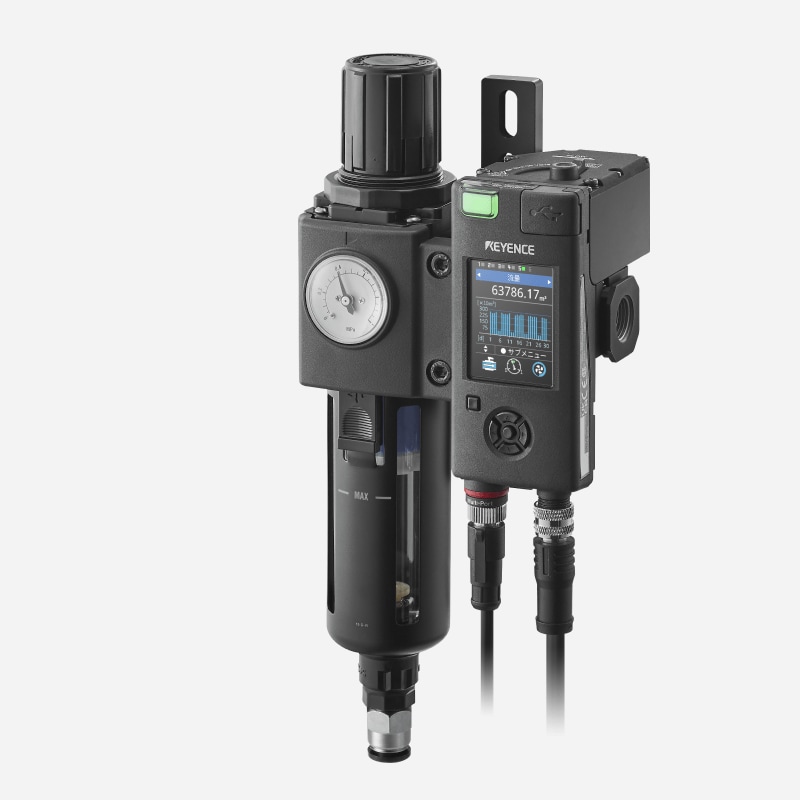
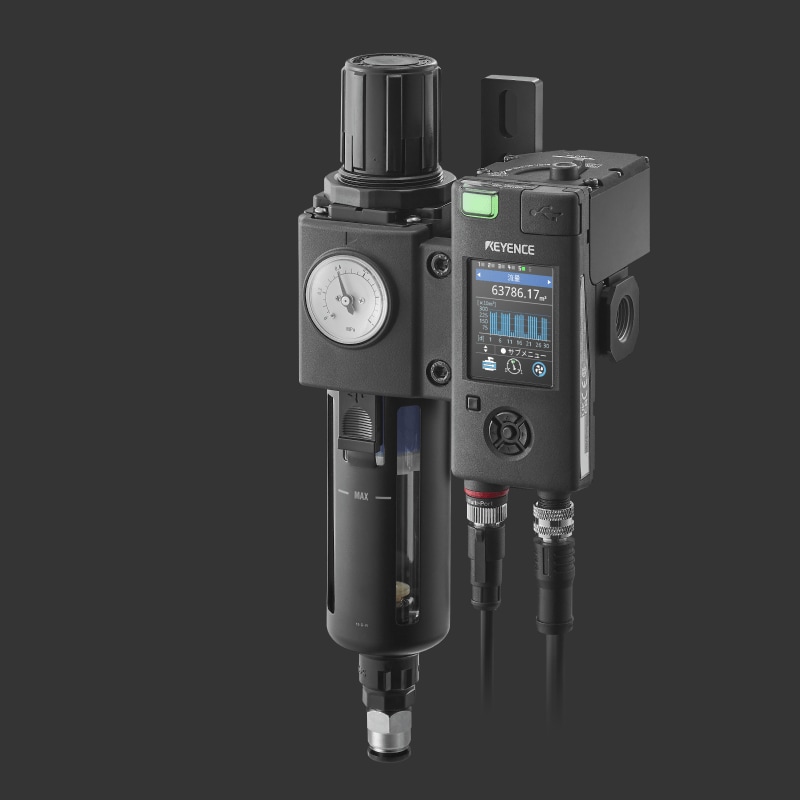
Energy-saving Unit
MP-F Series
- Flow rate
- Pressure
- Electric power
- Temperature
- Humidity
Energy saving achieved by just installing the unit
Shutoff valve reduces wasted air
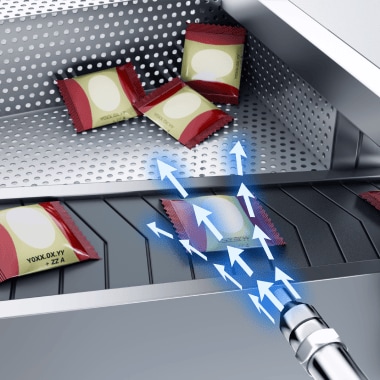
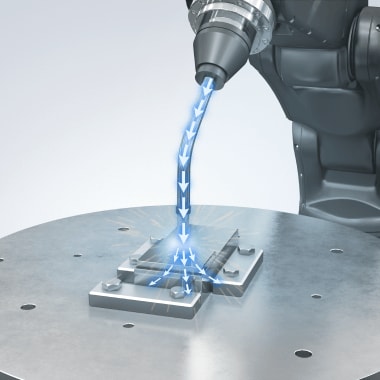
First-in-class! Clamp-on sensor easily visualizes air flows
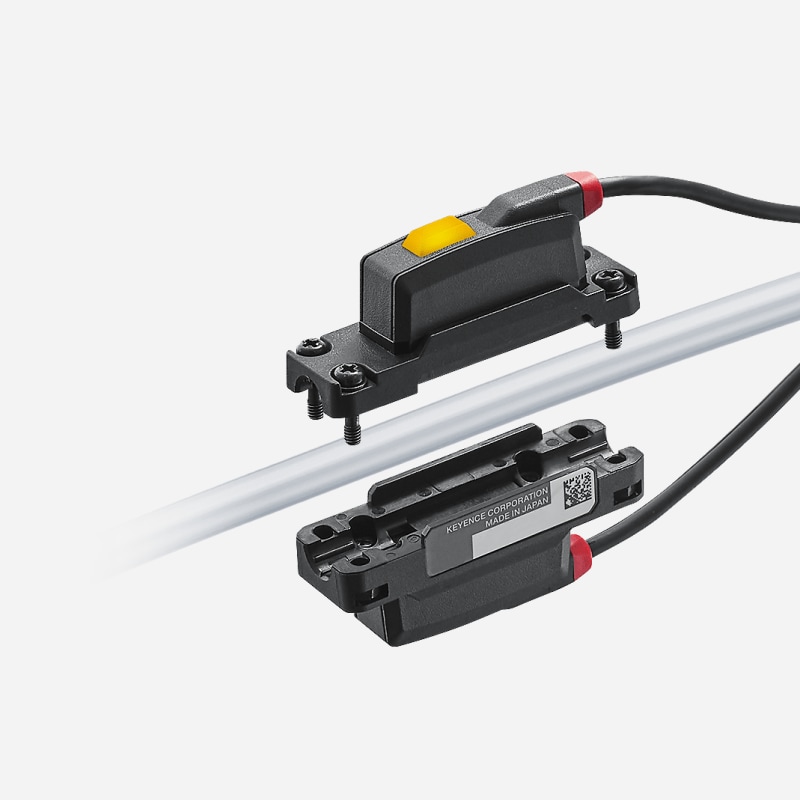
Ultra-compact flow sensor for gases
FD-E Series
- Flow rate
- Pressure
Optimizing the amount of air used at system terminals
No clogging or pressure loss
-
NG removal
-
welding
Products That Contribute to Reduction of Waste and Energy Savings in Marking Processes
FP-1000 Series UV Laser Coder, a product that changes common conceptions about packaging marking
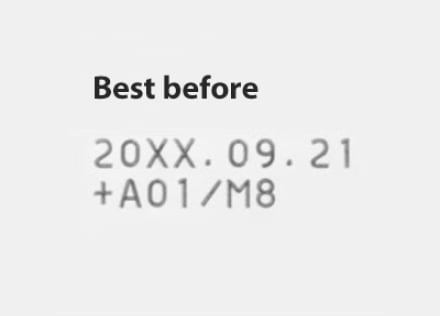
No faded marking
Marking that isn’t affected by water, oil, or powder on the surface and is resistant to rubbing with alcohol
No downtime
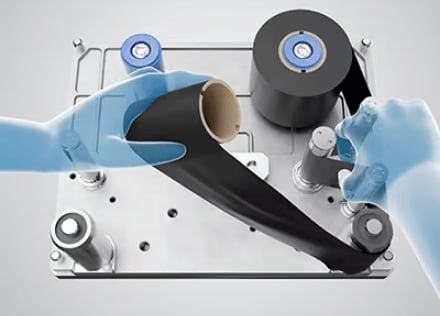
KEYENCE’s UV laser coder eliminates downtime for replacing ink ribbons and thermal heads.
No consumables
Say goodbye to costly consumables, maintenance, and inspections.
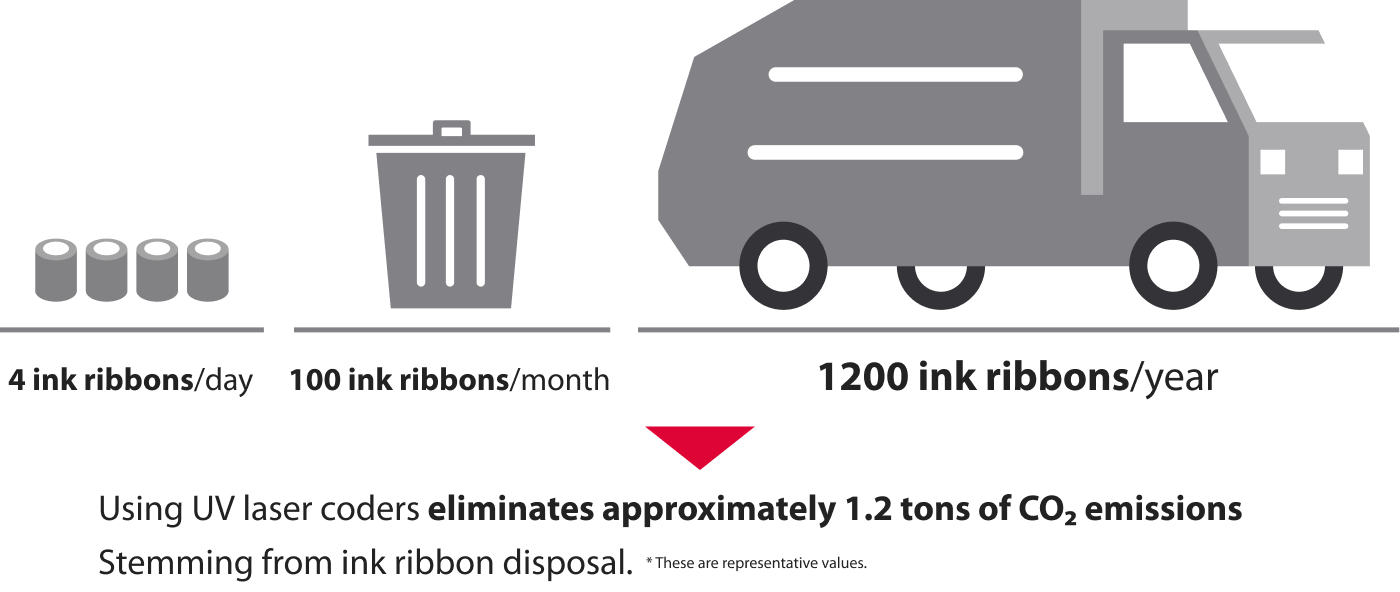
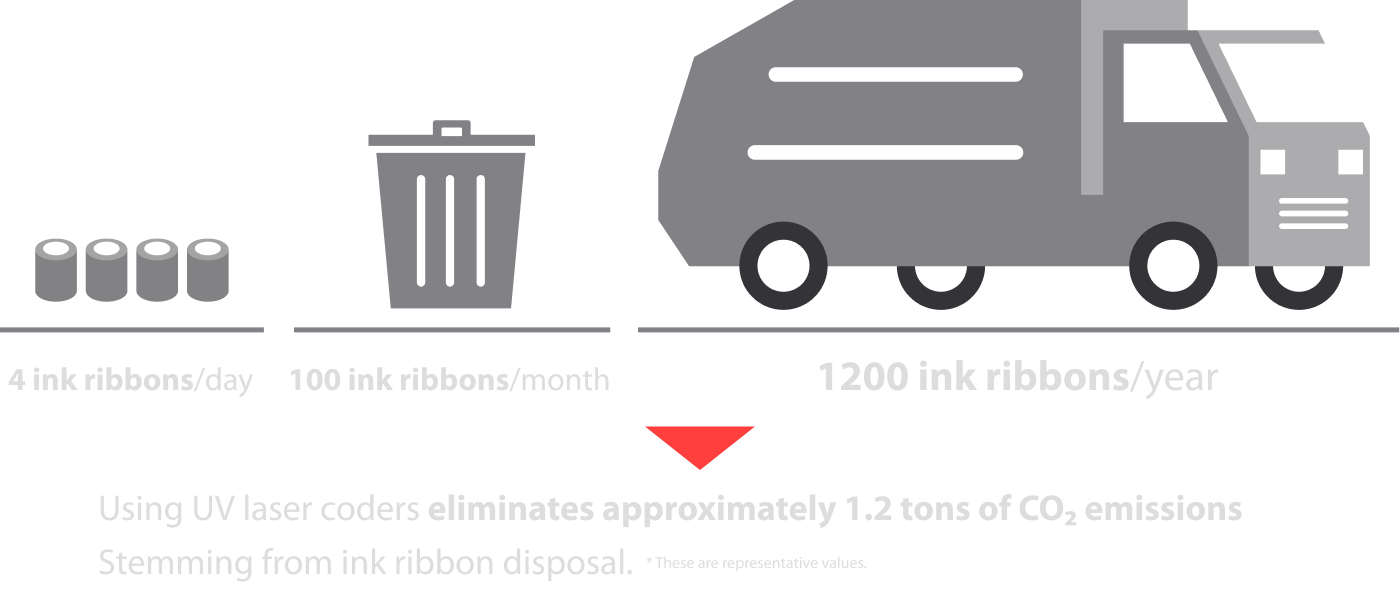
Eliminating CO2 Emissions from Ink Ribbon Disposal
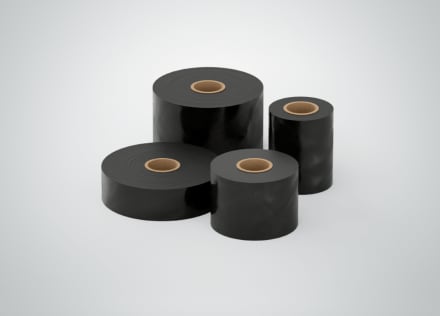
Because conventional thermal printers use ink ribbons, CO2 is emitted when disposing of used ink ribbons.
UV laser coders do not use ink ribbons, so these conventional CO2 emissions are eliminated.
- Disposal loss simulation
-
Assume that 4 ink ribbons are replaced each day at a factory that operates for 25 days each month. The result is that 1200 ink ribbons must be disposed of each year.
If 1 ink ribbon weighs 500 grams, 1200 ink ribbons will weigh 600 kilograms, which converts to approximately 1.2 tons of CO2 emissions during the disposal of these ribbons.
UV laser coders do not use ink ribbons, so these conventional CO2 emissions are eliminated.
Management of Chemical Substances Contained in Products
More and more regulations are being applied to the chemical substances contained in electrical and electronic products around the globe.
KEYENCE promotes green procurement of components and materials that we use in our products while sharing the various standards related to chemical substances in products with our suppliers. We are also working to fully comply with the various national and regional regulations on chemical substances as represented by the RoHS Directive and REACH regulation in the EU.
Efforts to Provide Safe Products
Ensuring product safety is the premise to advocating quality improvement.
We are working to further reduce risk during product design, development and manufacturing while complying with laws and regulations on product safety.
Efforts Regarding the EU’s RoHS Directive
In order to contribute to both the health of the human race and the conservation of our global environment, we are working to eliminate heavy metals and other harmful substances from our products. We are also continuously working for compliance with the RoHS Directive, the most prominent of the regulations on chemical substances contained in products.
RoHS Directive
Electrical and electronic equipment placed on the EU market must not contain restricted substances under the RoHS Directive.
Restricted substances under the RoHS Directive
Lead, Mercury, Cadmium, Hexavalent chromium, Polybrominated biphenyls, Polybrominated diphenyl ethers, Bis(2-ethylhexyl) phthalate*1, Butyl benzyl phthalate*1, Dibutyl phthalate*1, Diisobutyl phthalate*1
- *1 The specific phthalates which added by (EU) 2015/863. Most KEYENCE products are subject to the regulation from July 22, 2021.
Reducing Our Environmental Impact Through Business Activities
Efforts Toward Collection and Recycling
Paper recycling
We also conduct thorough collection and management of paper materials. In addition to efforts to digitize application forms that used paper in the past, we have installed recycling containers on each floor of our office. Paper is collected by a used paper company for delivery to a paper manufacturer. Through this recycling process, the paper can be reused for the production of cardboard boxes and other products.
Efforts Toward the Reduction of CO2
Switching to LED lighting
As part of our efforts to reduce our environmental impact, we are reducing our carbon footprint by switching to LED lighting at our head office building and all distribution locations.
Adoption of renewable energy sources
To reduce greenhouse gas emissions, KEYENCE is gradually introducing renewable energy sources in its properties.
Installation of solar power equipment is also being considered.
Replacing AC Equipment with High-Efficiency Equivalents
By switching to energy-saving air conditioner models with lower power consumption and compact models that use less resources, KEYENCE is employing environmentally friendly technology that will reduce its carbon footprint.
Adoption of Environmentally Friendly Vehicles
To further reduce its environmental impact, KEYENCE is gradually changing its fleet of commercial vehicles in Japan to environmentally friendly models.
Efforts Toward the Reduction of Waste at Distribution Locations
In the past, because packaging boxes were prepared for each product size, it was necessary to use cushioning material to fill the extra space. Through the use of automatic packaging equipment, we have cut down on the wasted space inside packaging. This has allowed us to reduce the amount of cushioning material that is required. It also contributes to the unification of packaging and allows us to run facilities with a smaller investment of resources and space.
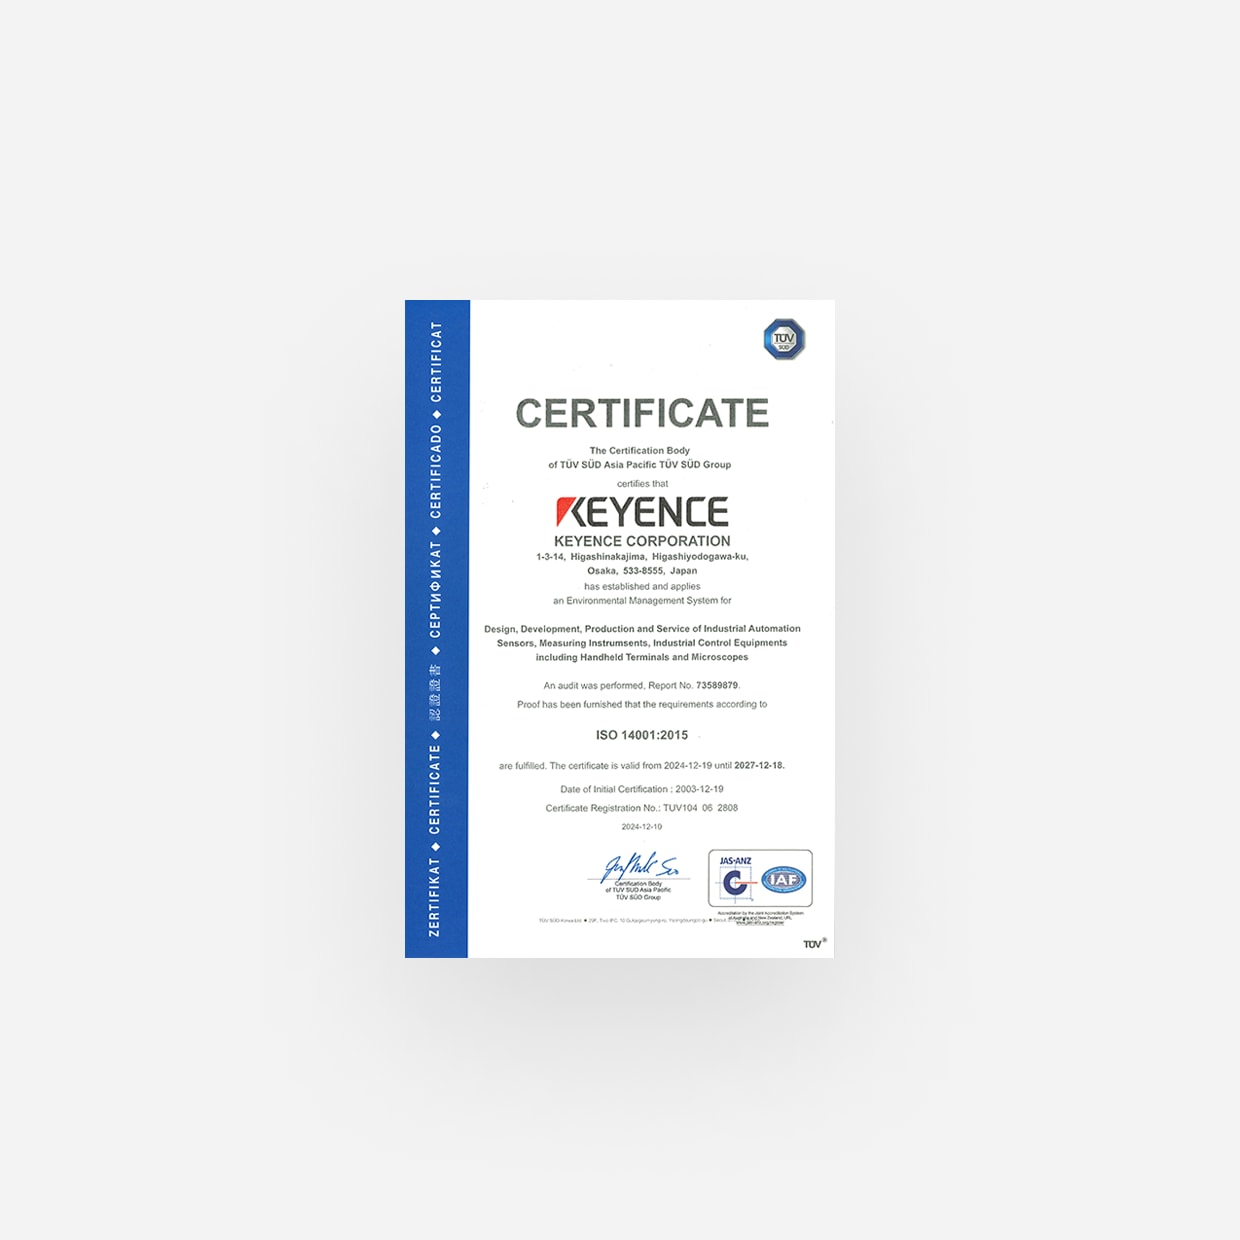
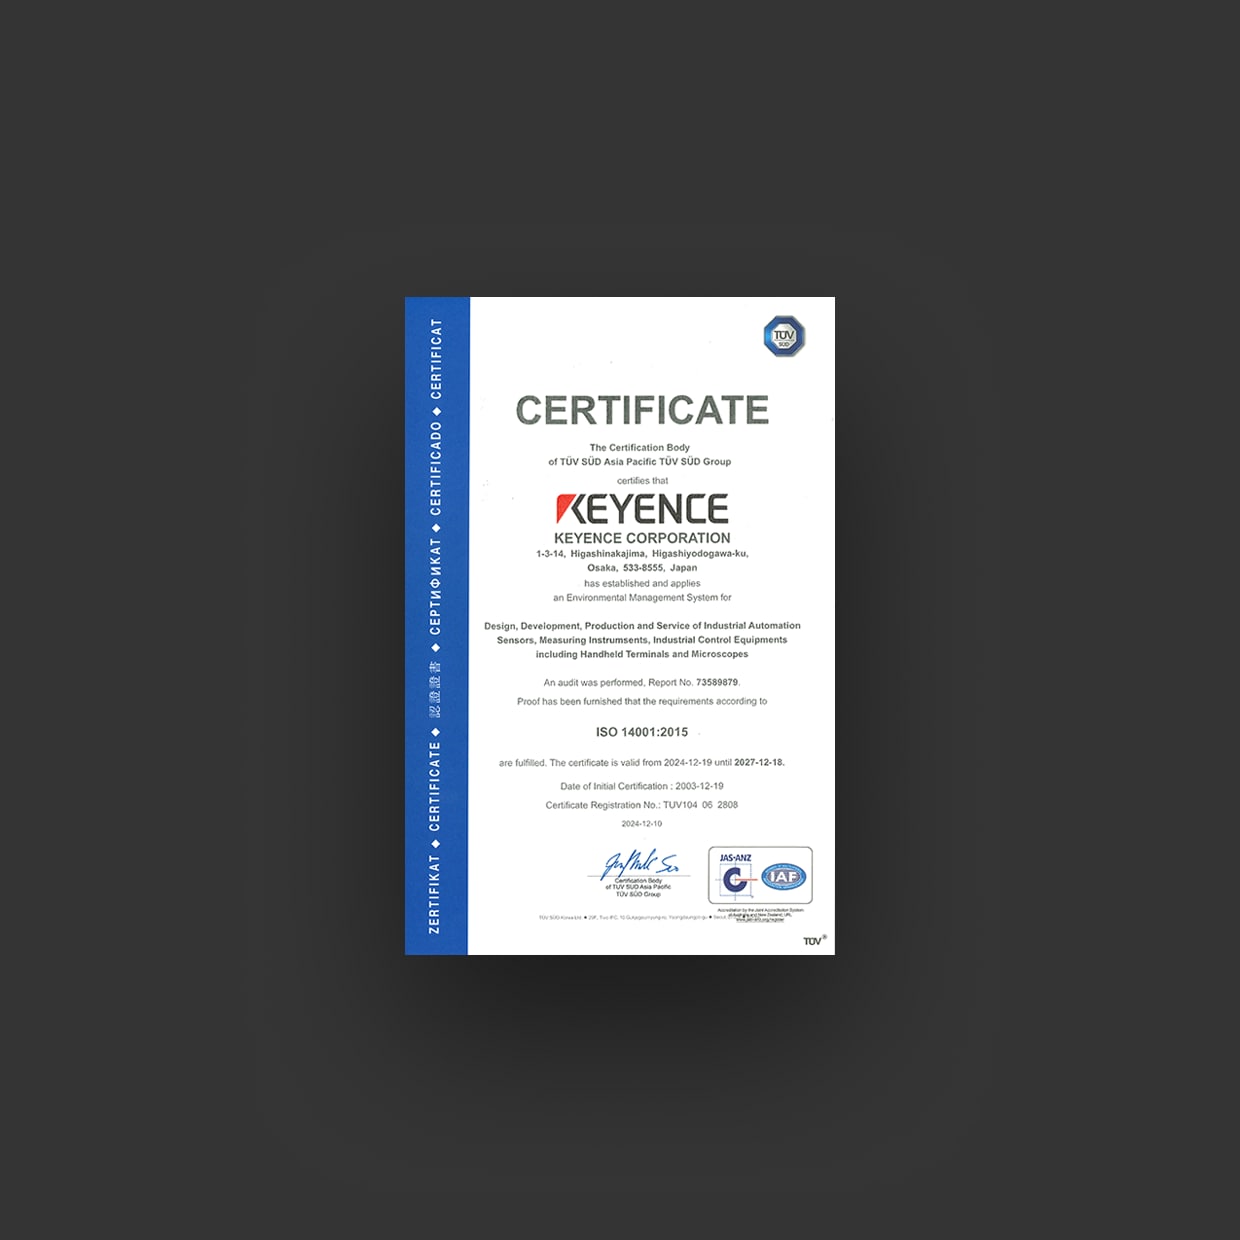
Acquisition of ISO 9001/14001 Certification
KEYENCE has acquired ISO 9001/14001 certification for its efforts to contribute to the environment through business activities and products.
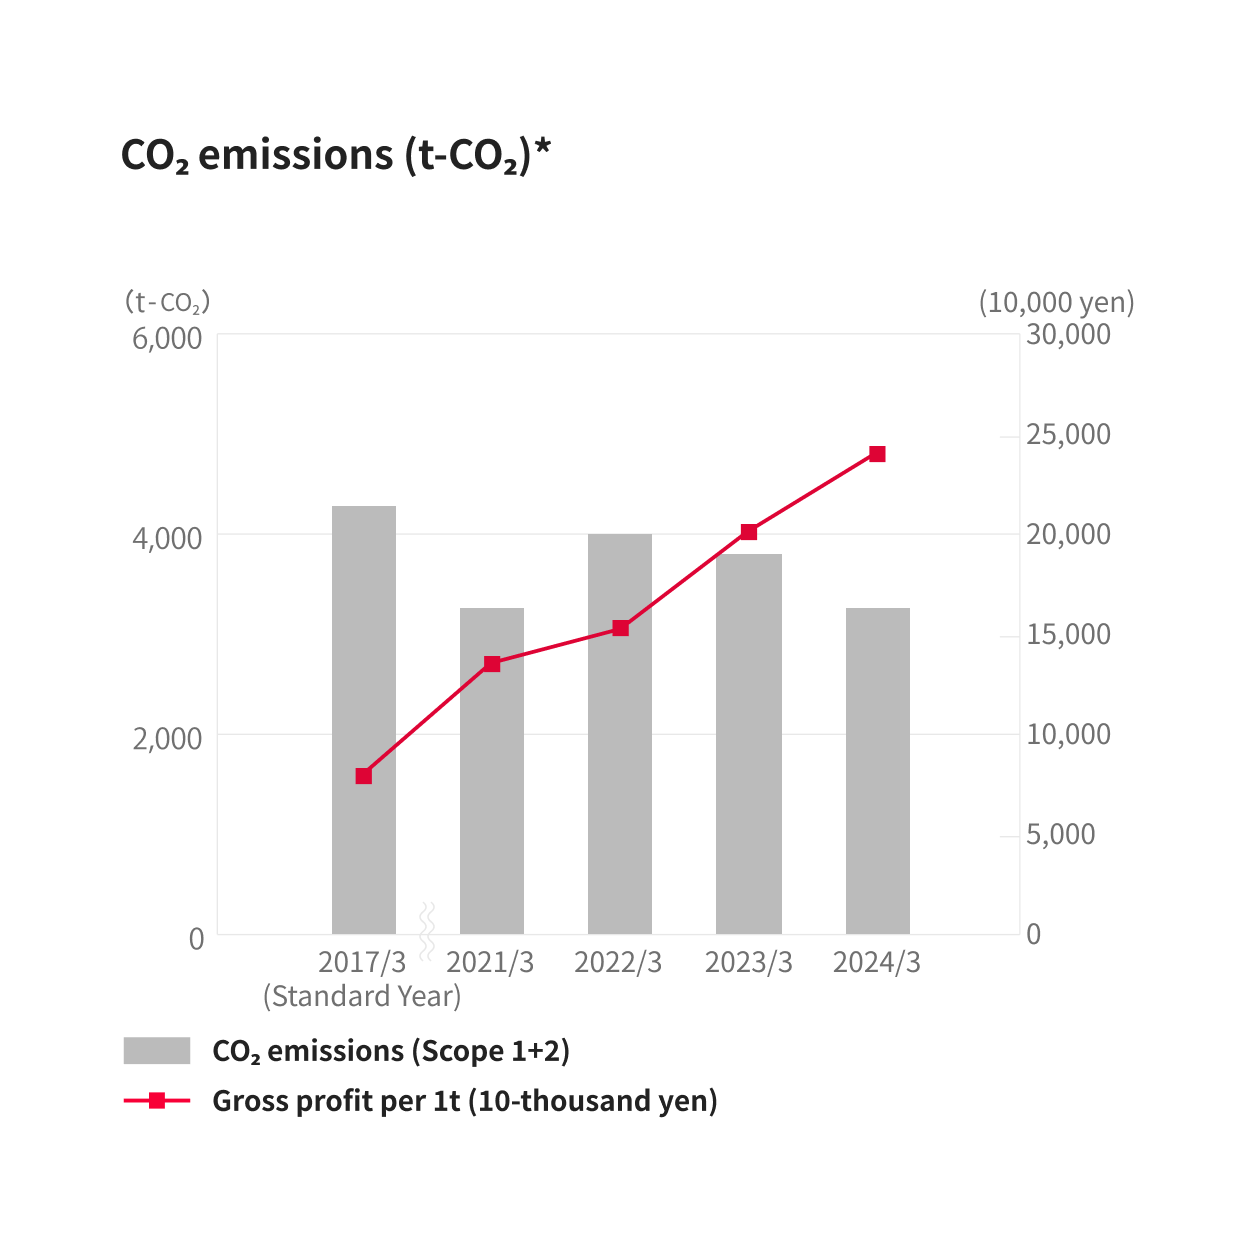
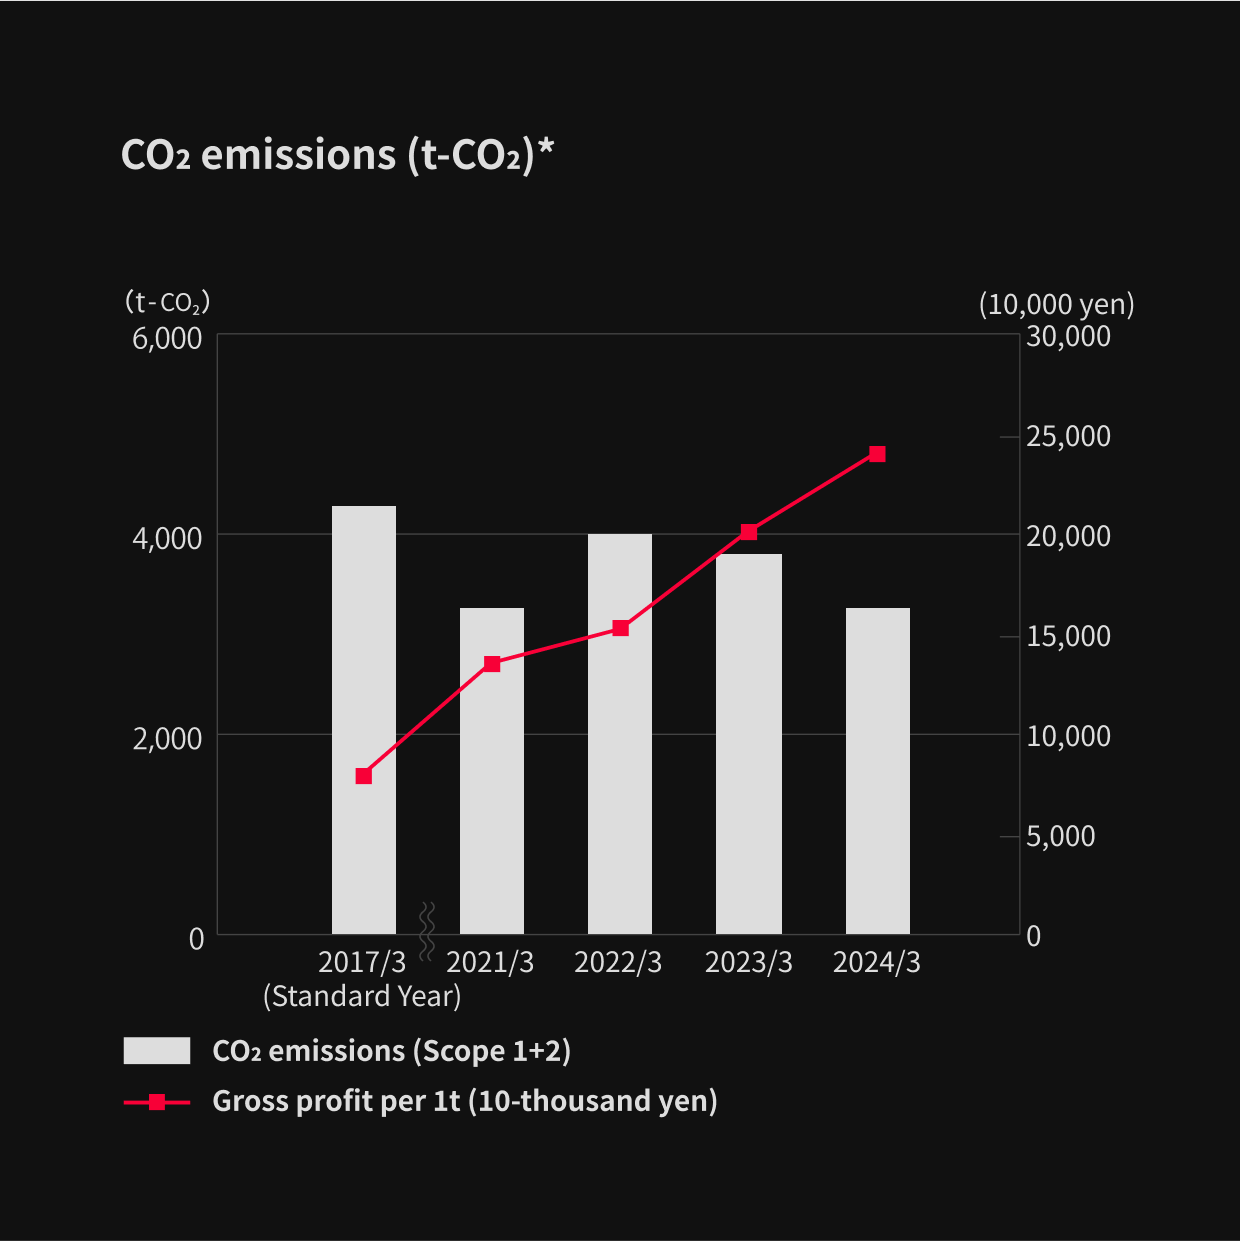
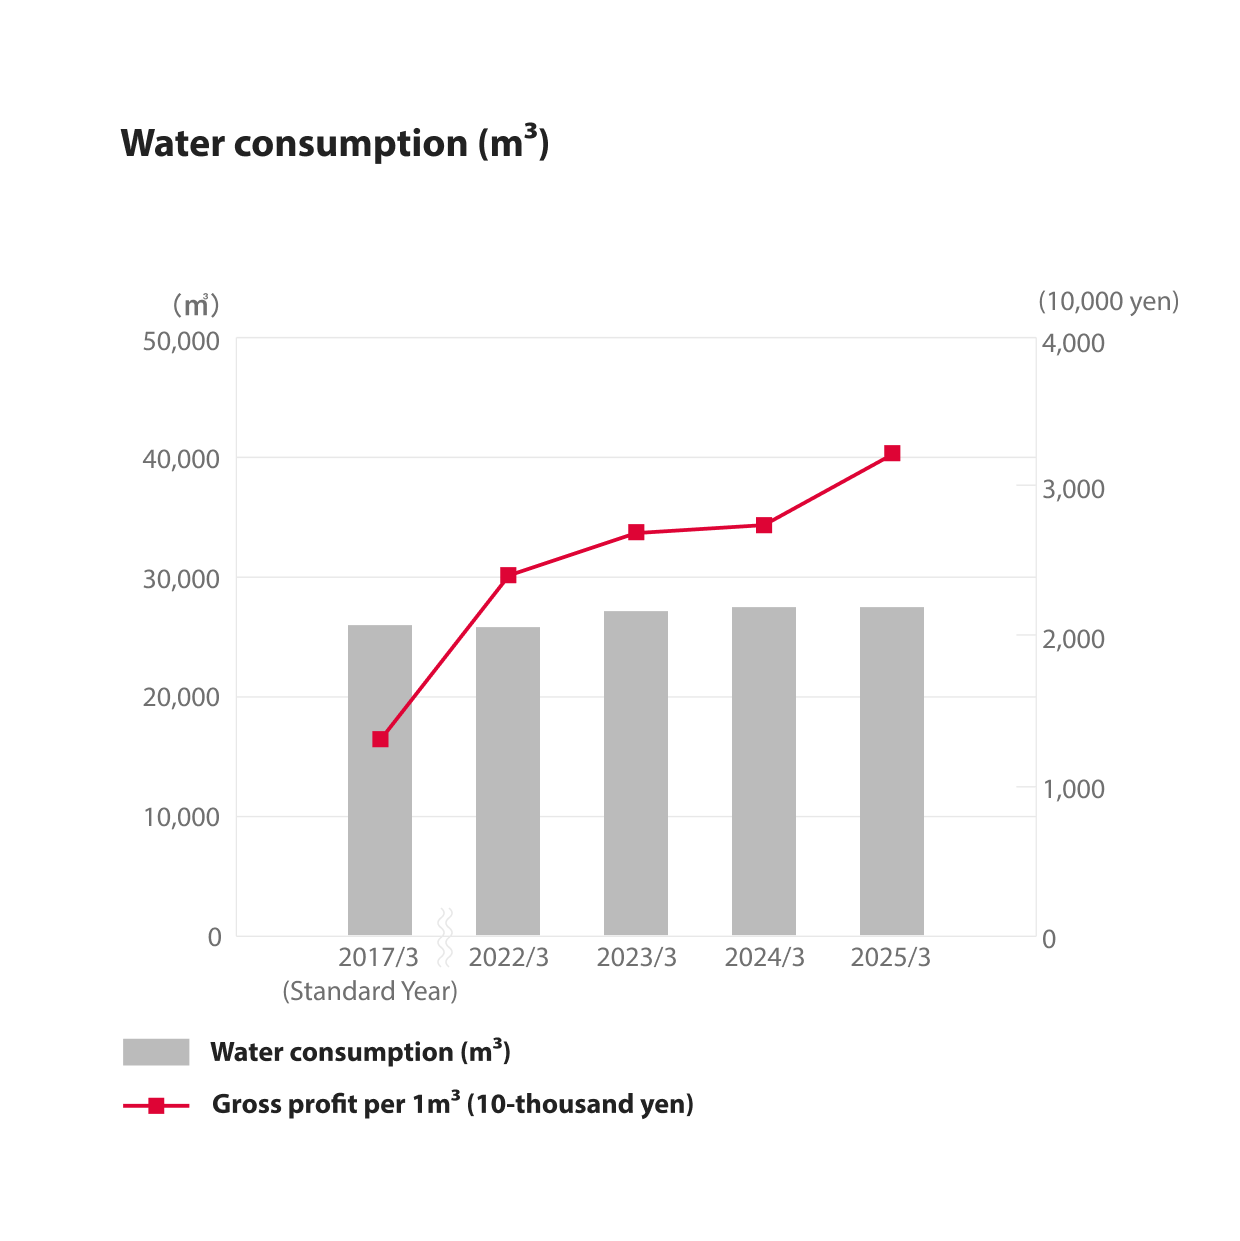
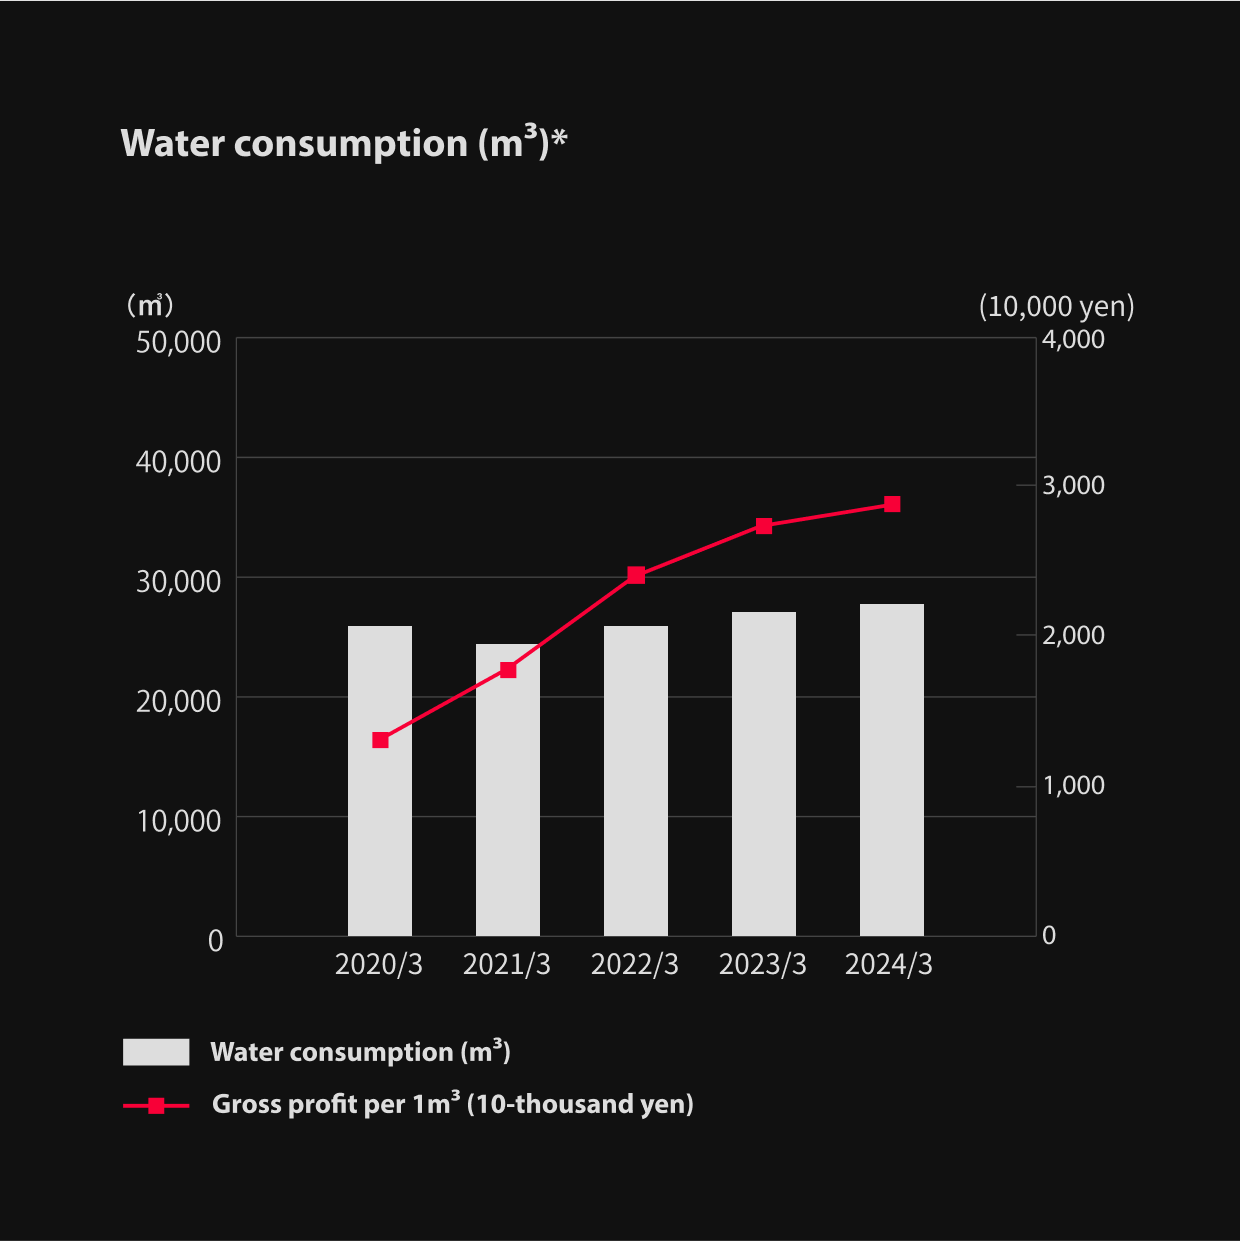
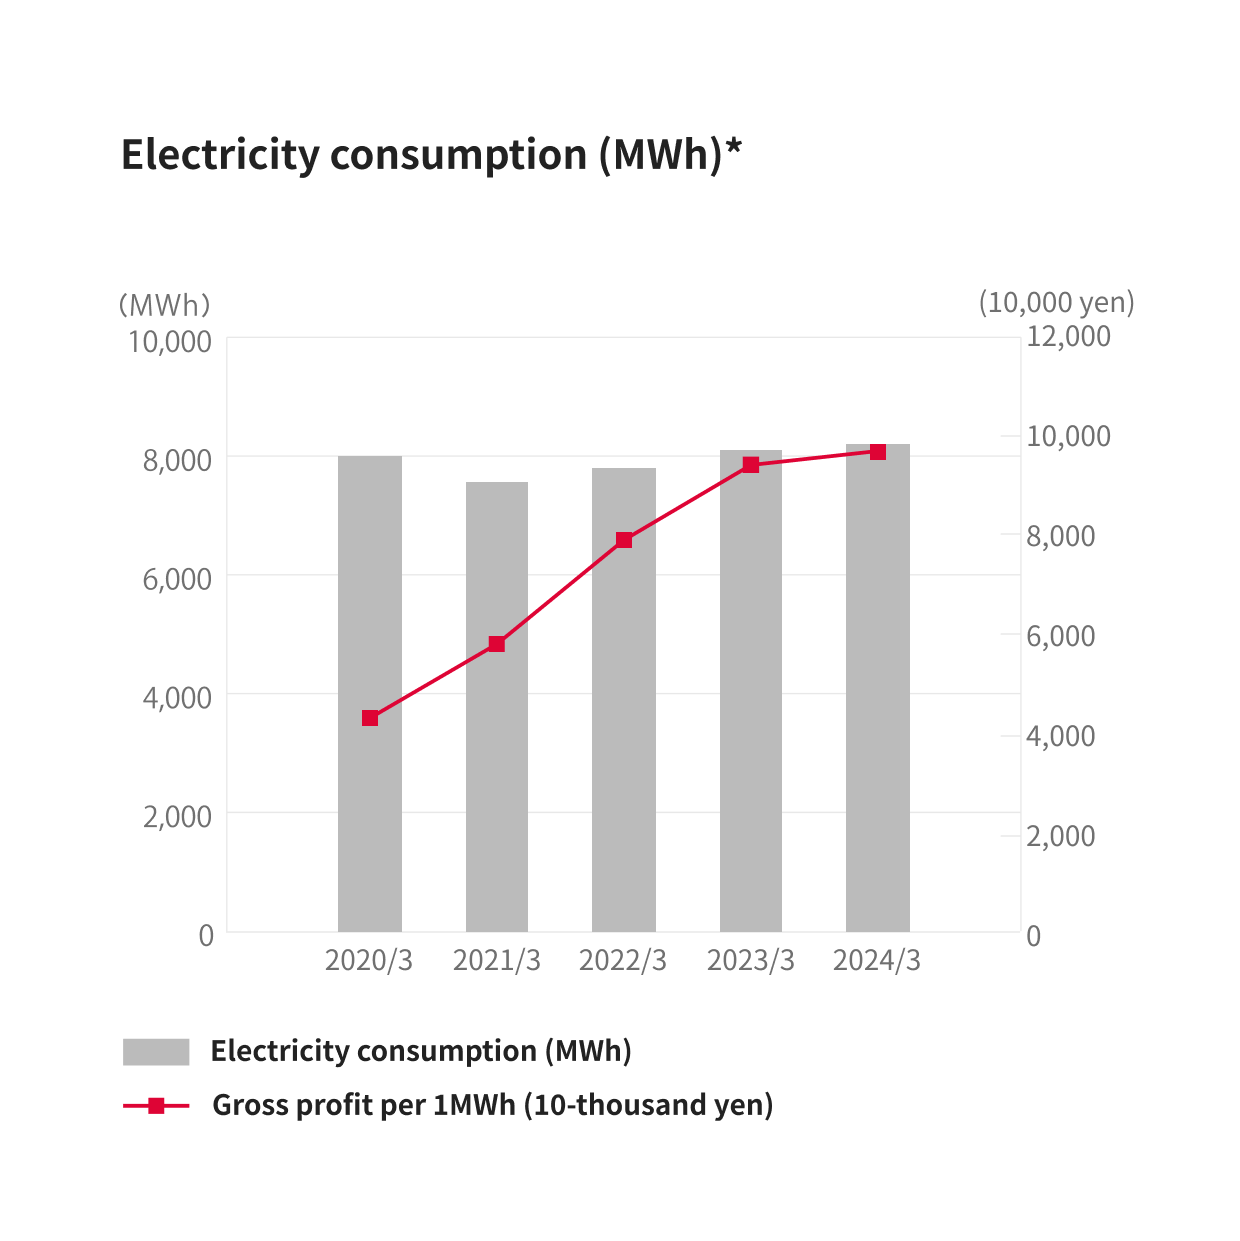
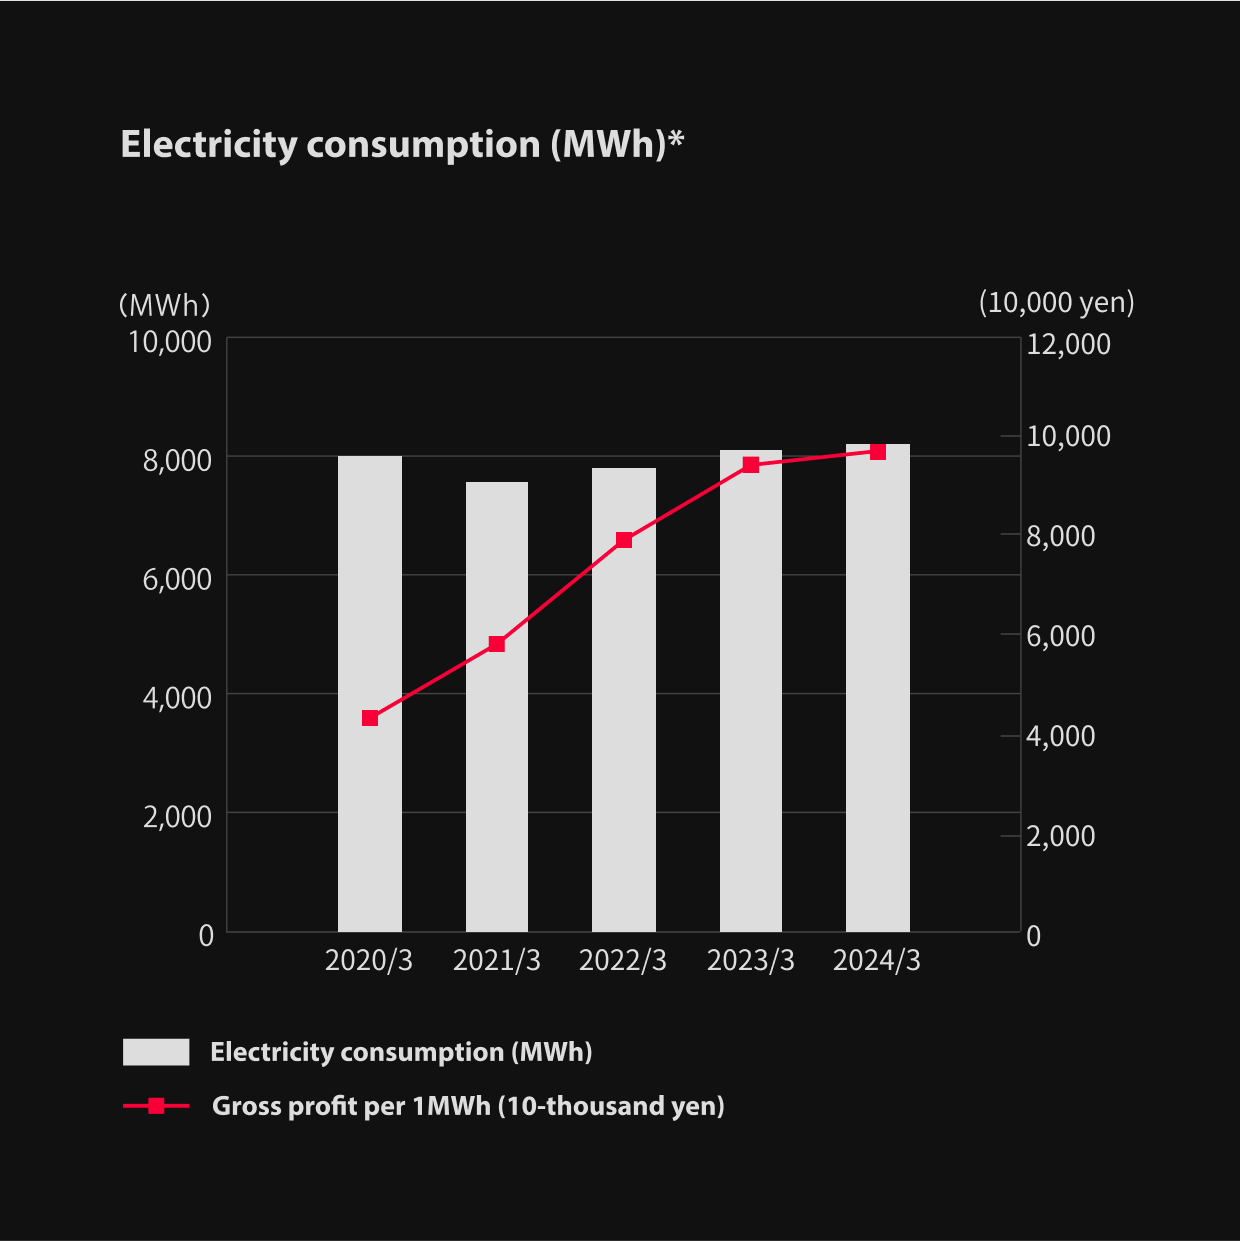
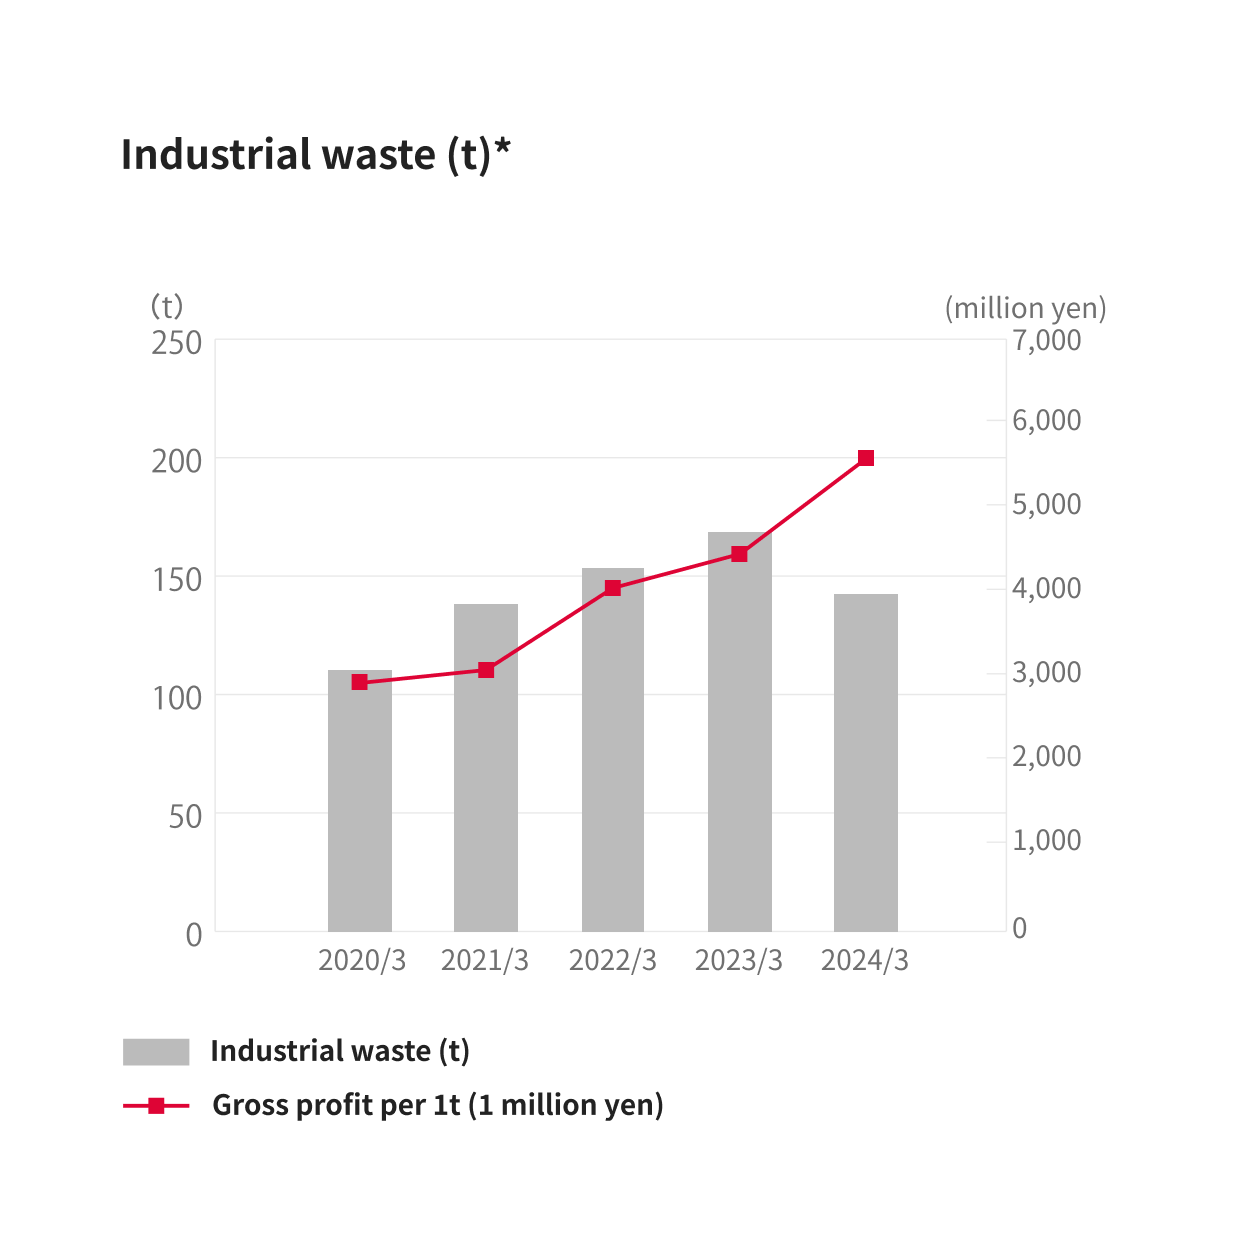
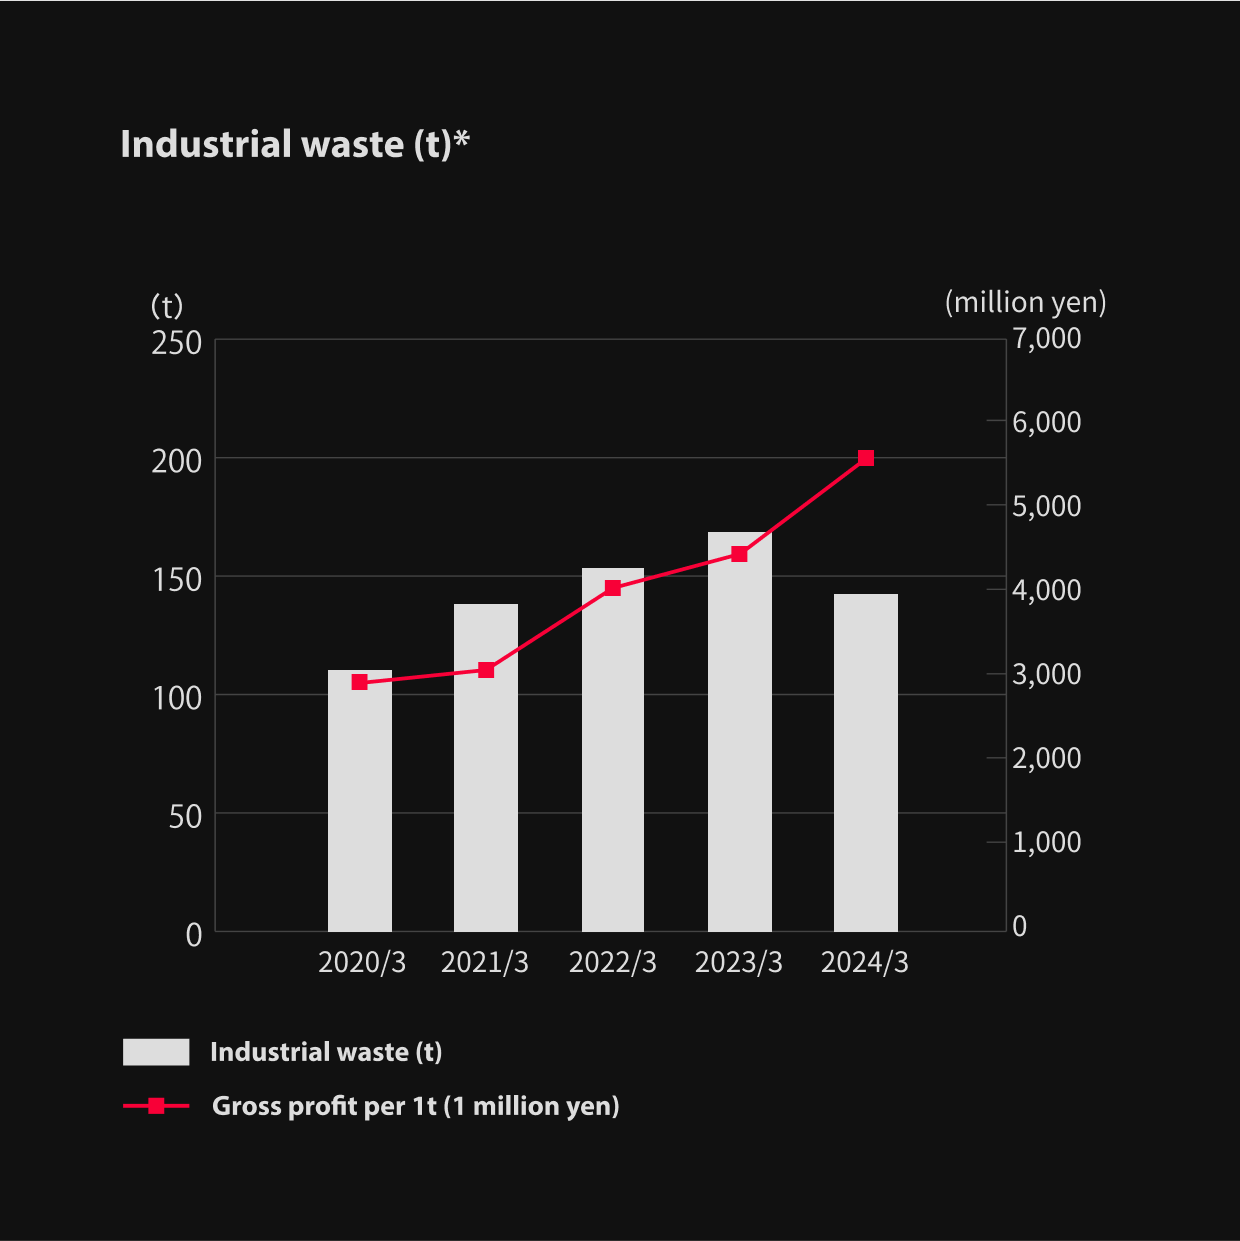
Environmental Numerical Data
We are consciously working to create maximum added value with minimum environmental load.
| Greenhouse gas (GHG) emissions | 2017 / 3 (Standard Year) |
2021 / 3 | 2022 / 3 | 2023 / 3 | 2024 / 3 |
|---|---|---|---|---|---|
| Scope1.2 (t-CO2)*1*2 | 4,225 | 3,268 | 4,000 | 3,791 | 3,330 |
| Gross profit per 1 t (10-thousand yen) | 7,890 | 13,493 | 15,530 | 19,909 | 24,097 |
| Scope3 (t-CO2)*3 | - | - | 1,278,948 | 1,545,190 | 1,239,243 |
| 2020 / 3 | 2021 / 3 | 2022 / 3 | 2023 / 3 | 2024 / 3 | |
|---|---|---|---|---|---|
| Water consumption (m3)*2 | 26,052 | 24,364 | 25,835 | 27,174 | 27,688 |
| Gross profit per 1m3 (10-thousand yen) | 1,280 | 1,810 | 2,404 | 2,777 | 2,898 |
| Electricity consumption (MWh)*2 | 8,005 | 7,610 | 7,910 | 8,076 | 8,214 |
| Gross profit per 1 MWh (10-thousand yen) | 4,164 | 5,793 | 7,853 | 9,346 | 9,770 |
| Industrial waste (t)*2 | 113 | 136 | 152 | 170 | 143 |
| Gross profit per 1t (1 million yen) | 2,952 | 3,237 | 4,084 | 4,429 | 5,610 |
- *1) KEYENCE has obtained third-party verification for Scope 1 and 2 emissions data from FY 2021 and reviewed the verification report.
- *2) Subjects of calculation: KEYENCE Head Office, Quality Lab, Takatsuki Logistics Center, Production Control Center, and Takatsuki Office
- *3) Subjects of calculation: KEYENCE stand-alone activities in Japan
MD-U series

Initiatives for Combatting Climate Change
Through careful consideration of the risks and opportunities climate change poses to operations, and in line with the final TCFD report, KEYENCE will continue sharing relevant information based on four topics: Governance, Strategy, Risk management, and Indicators and targets.
Governance
We recognize that climate change is one of the most pressing challenges to ensuring the sustainability of KEYENCE—one of the company's core management principles. Climate change initiatives are often promoted at Management Committee meetings and meetings where division managers are in attendance. The Board of Directors is responsible for overseeing the details of those initiatives.
Strategy
At KEYENCE, our business goal is to use products to solve the various challenges facing the manufacturing field. Going forward, the nature of manufacturing will continue to change dramatically. To address these changes and the accelerated evolution of the industry, we define our social contribution through continuous creation of new value the likes of which have never been offered before. Through our business activities and products, KEYENCE is dedicated to the fulfillment of our social responsibilities, particularly environmental conservation. In addition to reducing the environmental impact of KEYENCE products—including through reducing product size and promoting energy savings—we will continue to promote measures to prevent climate change and to preserve the global environment by helping our customers to reduce their environmental impact through our products.
However, climate change could affect our businesses in a variety of ways, not just from the impact of large-scale natural disasters on our business activities but also through stricter laws and regulations as well as changes in customers’ product selection criteria. With this in mind, we have conducted scenario analyses based on the TCFD approach. For these analyses, we considered a 1.5°C to 2°C (2.7°F to 3.6°F) scenario in which institutions around the world move toward a low-carbon society, and a 4°C (7.2°F) scenario in which global warming continues to progress as it currently is.* For these scenario analyses, we examined transition risks, physical risks, and opportunities related to climate change under each scenario, and we assessed their impacts on KEYENCE’s businesses.
-
*Based on the IPCC Sixth Assessment Report (AR6), scenarios SSP1-1.9 and SSP5-8.5.
Based on the IPCC Fifth Assessment Report (AR5), scenarios RCP2.6 and RCP8.5.
Scenarios such as STEPS, APS, and NZE from the IEA World Energy Outlook (WEO) are also referenced.
| Type of risk/opportunity | Identified risks and opportunities | Period | Level of impact | Countermeasure | |
|---|---|---|---|---|---|
| Transition risks | Market risk | Soaring raw material prices against a backdrop of soaring energy prices and policy changes such as a carbon tax | Medium to long term | Medium | Focus on development of products with low environmental impact, such as smaller and lighter products, and optimization of raw material procurement |
| Physical risks | Acute risk | Suspension of business activities such as production and shipping due to the increased severity of natural disasters (including tsunamis, floods, torrential rains, and lightning) | Short to long term | Medium | Promote the diversification of production sites by leveraging fabless and promote the decentralization of logistics hubs in various countries while optimizing inventory management |
| Chronic risk | Increased energy costs due to higher average temperatures | Medium to long term | Low | Adopt new energy-saving equipment and replace existing equipment with newer models | |
| Opportunities | Products and services | Increased demand for low-carbon products such as EVs and FCVs; Increased demand for FA equipment driven by greater capital investment among manufacturers | Medium to long term | High | Strengthen research and development to expand product lineups to better meet a wide range of production site needs and enhance proposal capabilities by expanding the sales system |
| Products and services | Growing need for management and visualization of energy usage, including air and electricity; Increased demand for sensors and measurement/control devices | Medium to long term | High | ||
| Products and services | Increased demand for FA equipment and energy-saving equipment following progression of production automation and energy-saving initiatives | Medium to long term | High | ||
- Definition of periods: Short-term = 1 year, Medium-term = 5 years, Long-term = more than 5 years
-
Definition of level of impact:
High = Significant expansion or contraction of business activities.
Medium = Some business activities are affected.
Low = Business activities are only minorly impacted.
In the evaluation under the 4°C (7.2°F) scenario, the focus is primarily on promoting measures to address foreseeable physical risks.
Under the 1.5°C to 2°C (2.7°F to 3.6°F) scenario, while addressing the increase in business costs due to policy changes is important, we also anticipate an increase in business opportunities. These include greater capital investment driven by the growth in the production of energy-efficient products and rising demand for energy-saving solutions. Overall, we expect that the positive impact of increased business opportunities will outweigh the negative impacts for KEYENCE as a whole.
Risk Management
- At KEYENCE, we regularly gather information on climate change regulations and risk factors that may affect business.
- In addition to comprehensively evaluating and determining relevant risks and potential impacts on business at Management Committee meetings and meetings where division managers are in attendance, we consider available countermeasures. The results of reviews and the policies determined for addressing problems are then reported to the Board of Directors.
Indicators and Targets
- KEYENCE is dedicated to the planning and development of products that contribute to reducing our environmental impact.
- We strive to help customers reduce their own environmental impact through our products.
- We intend to reduce greenhouse gas emissions from business activities (Scope 1 + 2) by 43% in FY 2030 compared to FY 2016 levels.