Home  >  Roughness measurement examples

Roughness measurement examples


Automotive and Metal Industry

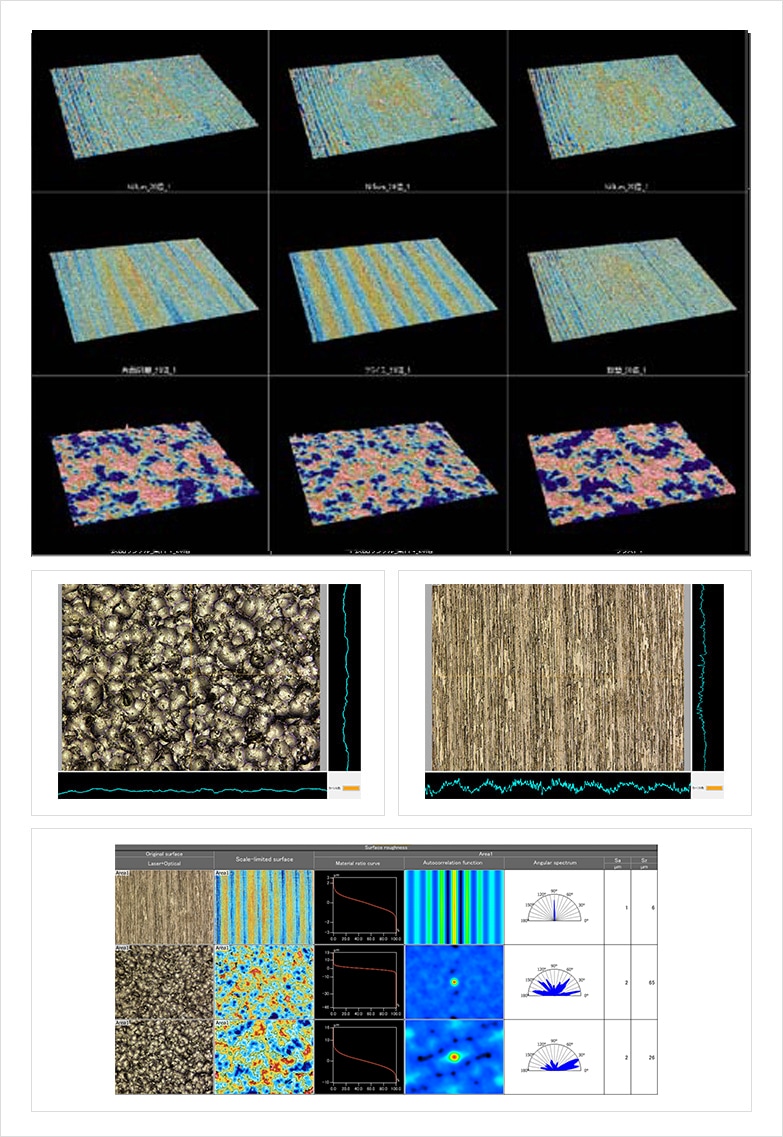
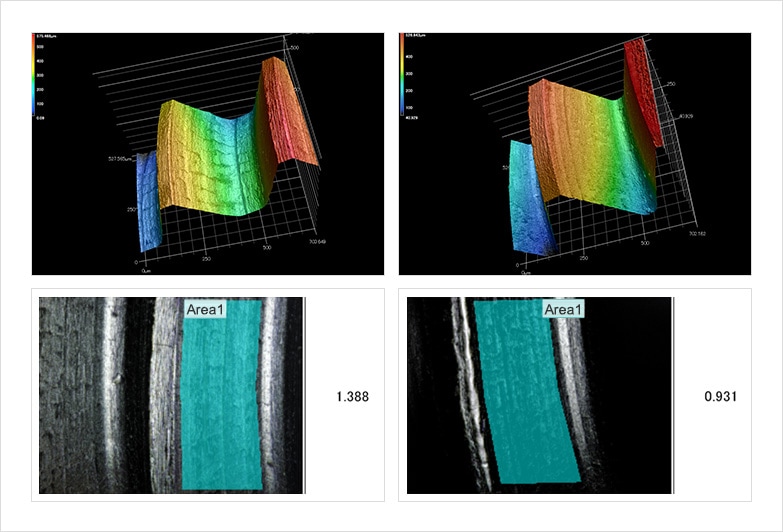
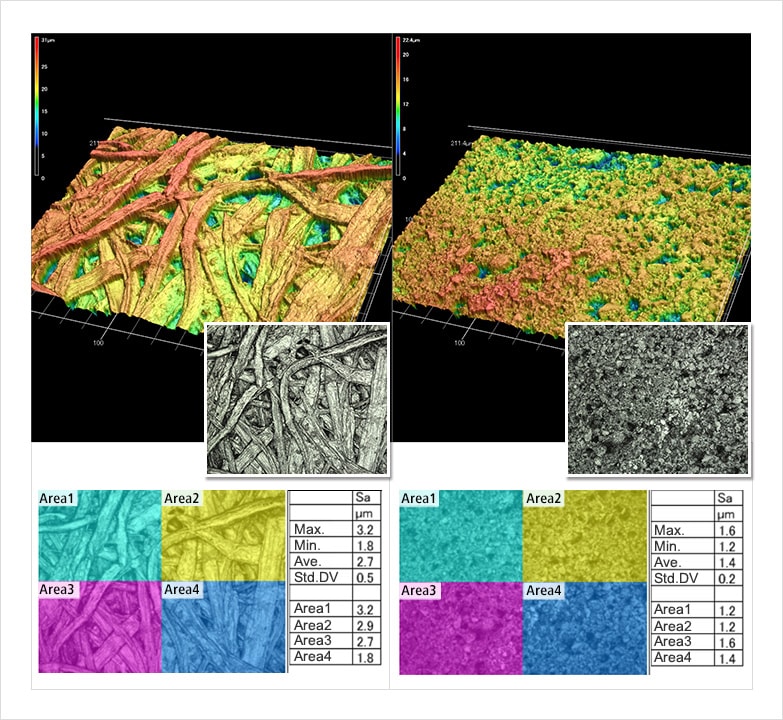
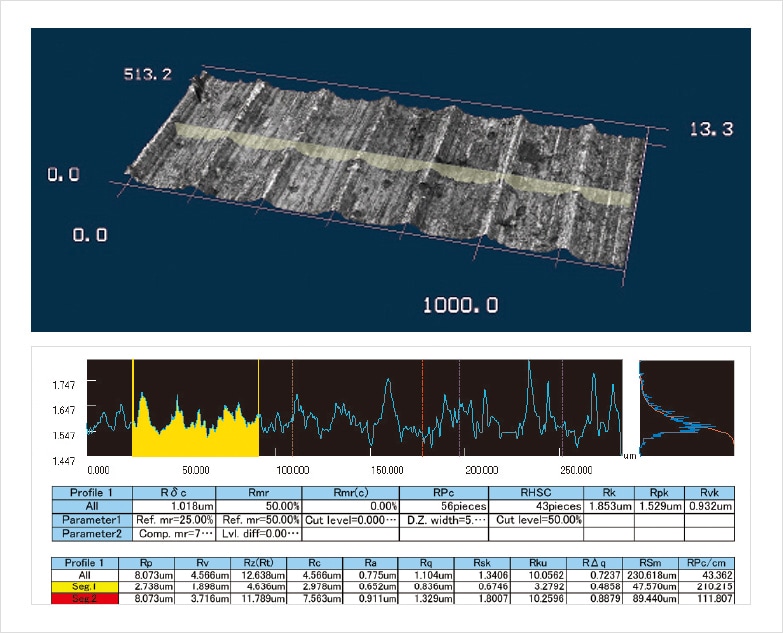
Analysis of sliding surface smoothness/protrusion height — Ra (Arithmetic mean roughness) / Rz (Max. height)

Steering components

Ra measurements look at the smoothness of a sliding surface and Rz measurements look at the surface height. Because using Ra alone may cause some points, such as single protrusions, to be overlooked it is important that both Ra and Rz be used together.

Download the case studies catalog

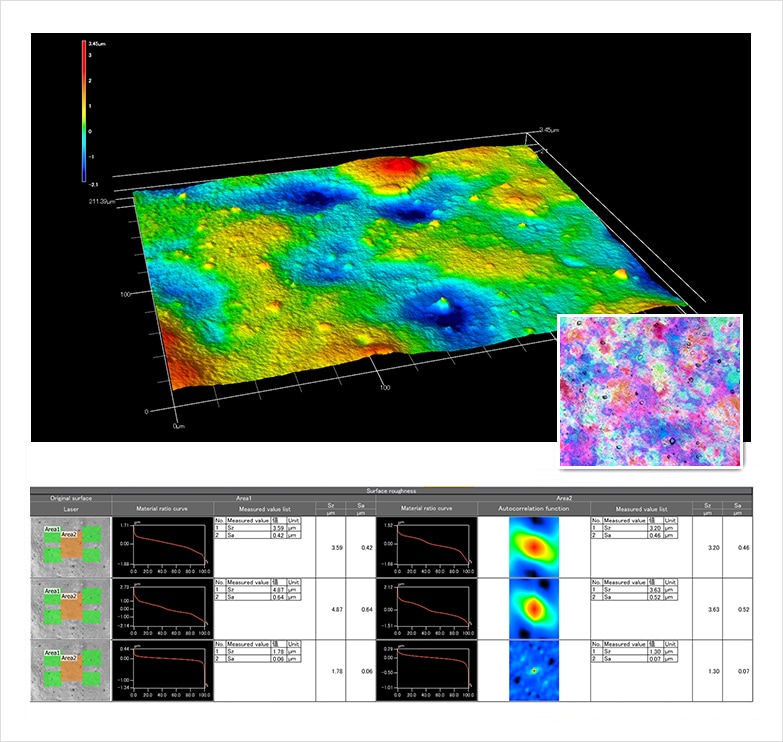
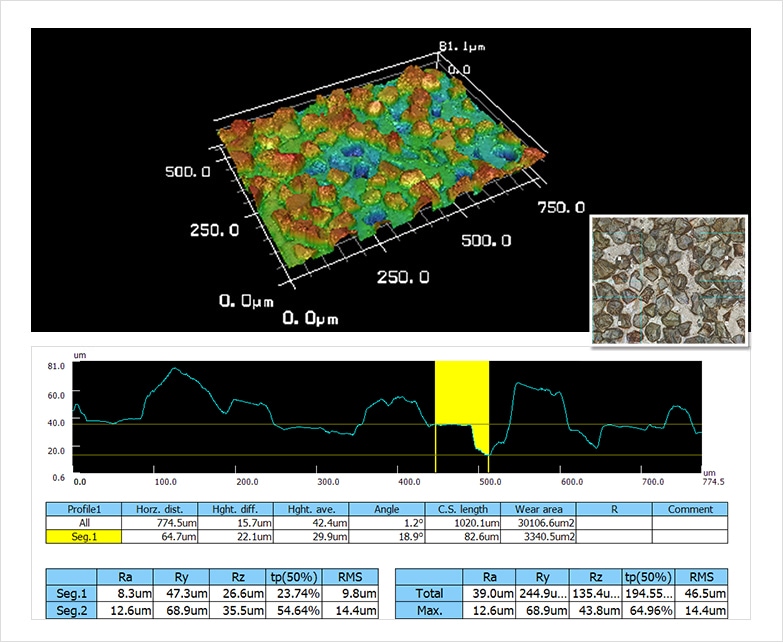
Quantification of grindstone quality by looking at roughness — Ra (Arithmetic mean roughness) / Rz (Max. height)

Metal grindstone

Ra and Rz are used to look at the completed condition of the grindstone by looking at the differences in individual grits. Through management using numerical values, stable quality can be assured.

Download the case studies catalog

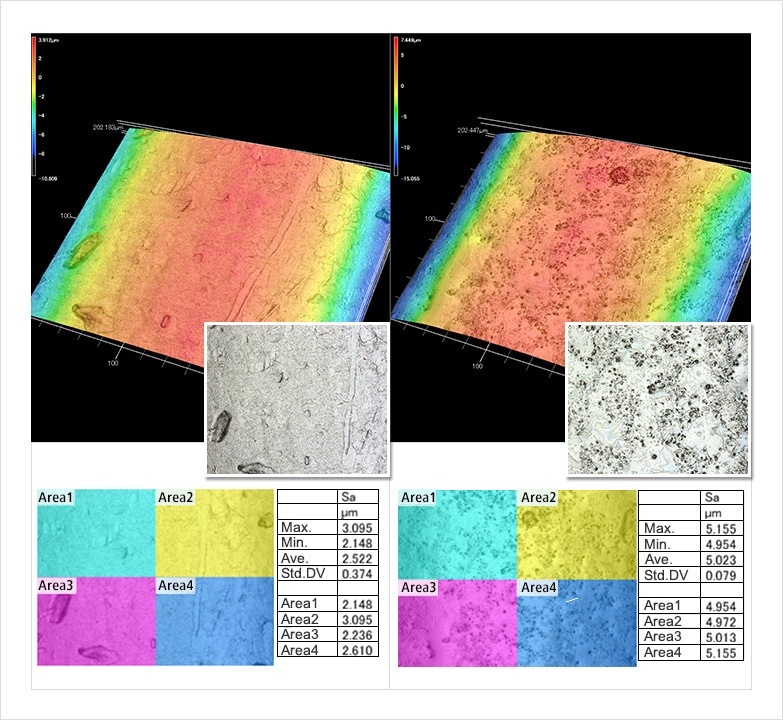
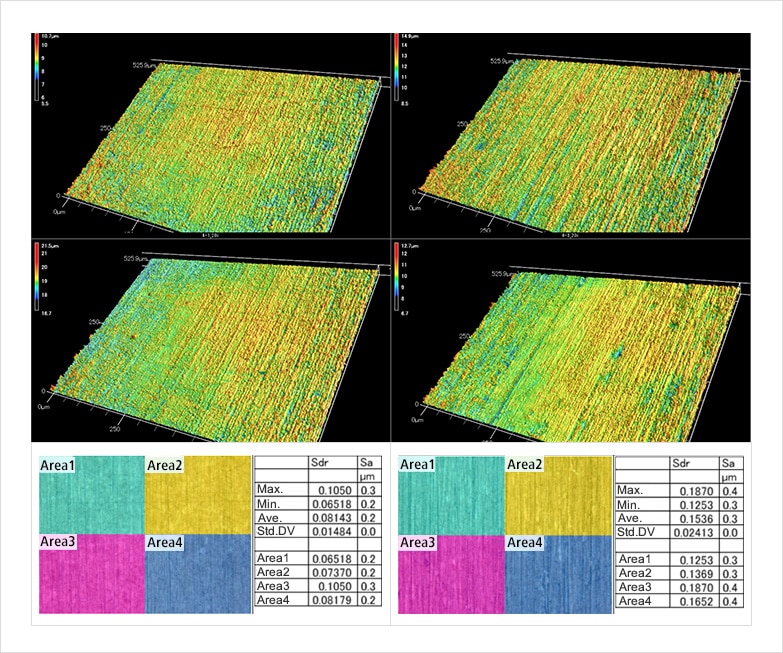
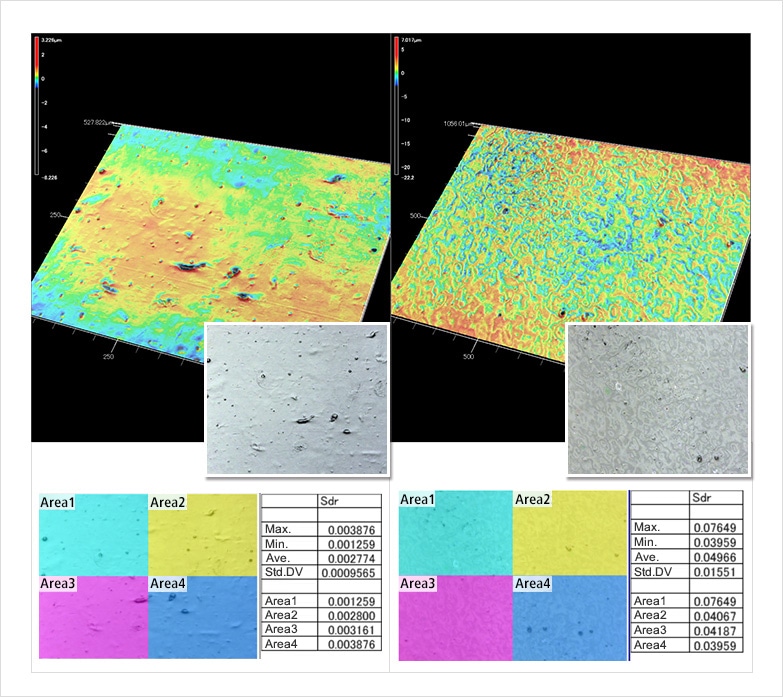
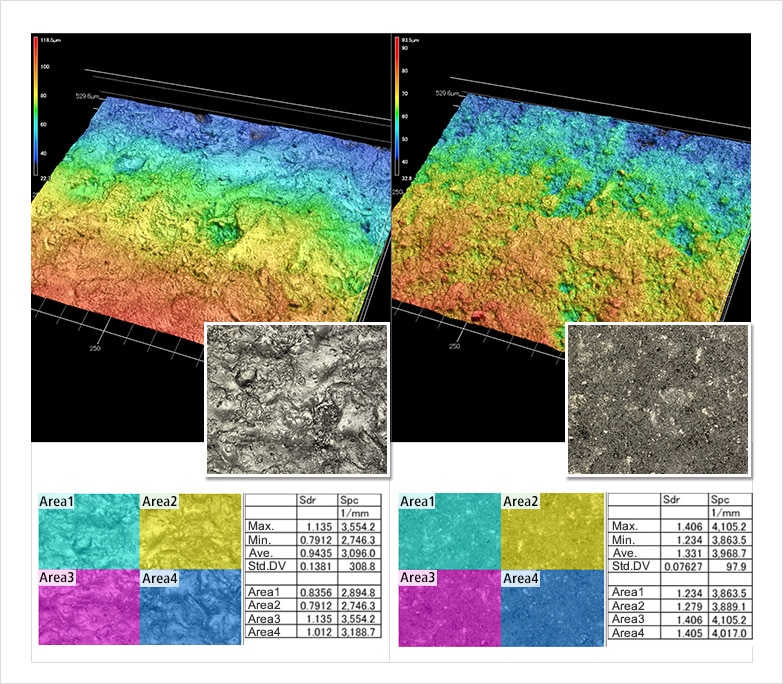
Quantification of differences in metal processing methods — Sa (Arithmetic mean height) / Sz (Max. height) / Str (Texture aspect ratio)

Processed metal surface

This analysis compares changes in surface properties that arise from different processing methods. Sa and Sz analysis looks at the finishing condition, while Str analysis checks whether processing traces can be found in external appearances.

Download the case studies catalog


Electrical Machinery and Electronics Industries

Failure analysis of solder — Sa (Arithmetic mean height)

Solder surface

Sometimes during soldering, the solder will spread out over a wide area and cause a voltage leak. By comparing OK products with NG products through Sa analysis, it becomes clear that the NG products are rougher. By extending the evaluation area from a line to the entire surface, it allows for even more reliable analysis.

Download the case studies catalog

Post-etching evaluation of copper with varying conditions — Sdr (Developed interfacial area ratio) / Sa (Arithmetic mean height)

Copper plating made under varying processing conditions

The roughness of corroded copper-plated surfaces can affect the quality of subsequent processing such as soldering. Sdr and other analyses are effective at evaluating surface area, while Sa is effective at analyzing the overall roughness.

Download the case studies catalog

Wear trouble analysis of mated material — Sa (Arithmetic mean height)

Sliding portions of screws

Because resins of mated material may become scraped, Sa analysis is used to look at the smoothness of sliding surfaces. Products that employ different processing methods have smaller Sa values, allowing for improved verification results. This allows for quantification of indices used to maintain quality.

Download the case studies catalog


Chemical and Raw Materials Industries

Effects of printing on paper quality — Sa (Arithmetic mean height) / Sz (Max. height)

Film surface

Sa and Sz analyses are effective for numerical management of film roughness. Analyzing film surfaces not only helps reduce oversights but also can help with ensuring stable quality of multi-layer films, managing glossiness, and more. In addition, using non-contact type measuring instruments ensures that the shape of the target is not affected.

Download the case studies catalog

Effects of printing on paper quality — Sa (Arithmetic mean height) / Rsm (Average length of elements)

Comparison of printing paper

When it comes to influencing print quality, surface smoothness is an important factor. Although Ra analysis is often used for evaluations, more reliable evaluation is possible by looking at Sa values, which take into consideration the entire surface. Looking at the entire surface of a product when analyzing quality is an effective means of evaluation. Analyses such as Rsm, which looks at cyclical unevenness, are also effective.

Download the case studies catalog

Evaluation of adhesive force of tape employing different manufacturing methods — Sdr (Developed interfacial area ratio)

Adhesive tape

Sdr analysis can be used to look at how sticky an adhesive material is according to the production method of the adhesive tape. Sdr analysis allows for a proportional expression of increase for an actual surface area with the object being flat as the reference, allowing for numerical management of the degree of surface area increase.

Download the case studies catalog


Other

Sticking factor analysis of tablets — Sdr (Developed interfacial area ratio) / Spc (Arithmetic mean peak curvature)

Tablets

When it comes to tablets, pestle roughness is one factor that affects sticking. Through analysis of tabletting traces on tablets, it is possible to guess the roughness of the pestle. By looking at these analysis figures regularly, it is possible to discern pestle deterioration. Comparing normal conditions with abnormal conditions make it possible to see differences in roughness.

Download the case studies catalog


"Roughness measurement examples" page list


Back to top

Other Pages