3D Optical Profilometers
Evaluating Fracture Surfaces From Charpy Impact Tests
Impact tests are material tests that are performed to determine the toughness and brittleness of materials when they are subjected to impact. Impacts tests include the Charpy pendulum impact test, Izod impact strength test, tensile impact test, falling ball (weight) impact test, Dupont impact test, and dart impact test. The tests which are used in industrial fields are the Charpy impact test and Izod impact strength test.
The Charpy impact test is particularly essential for materials used in parts that are subjected to strong impact or high pressure, such as those used in the power generation units and piping of nuclear power plants.
This page explains basic knowledge of the Charpy impact test and test pieces and how to evaluate the test results. It also introduces problems in evaluating test results and in conventional measurement methods, as well as a solution to these problems.
Charpy Impact Test
In the Charpy impact test, an impact load is applied to a test piece using a pendulum hammer in order to fracture it. The impact value is derived from the energy at the time the test piece fractured, and is used to evaluate the toughness and brittleness of the test piece material.
If the hammer swings to a high angle after fracturing the test piece, this indicates that the test piece failed to absorb the impact. If the hammer swings to a low angle, this indicates that the test piece absorbed more of the impact.
A test piece material which absorbed a larger impact can be evaluated as being superior in terms of impact strength. When the hammer swing angle is prescribed, then if the measured swing angle of the hammer is higher than the prescribed angle, then the material fails the test.
Charpy Impact Test Evaluations
The Charpy impact test measures the angle that the hammer is initially lifted to and the inertial swing angle of the hammer after fracturing the test piece. The fracture surface of the test piece is also evaluated because it contains information indicating how the test piece fractured.
Evaluation of Absorbed Energy at the Charpy Impact Test
The Charpy impact test is used to find the amount of absorbed energy, meaning the amount of energy which was expended in fracturing the test piece. This energy can be calculated from the angle the hammer was initially lifted to, and the angle the hammer swings up to on the opposite side after fracturing the test piece. Following are a schematic view of a Charpy impact test machine and the formulas used to calculate the absorbed energy and Charpy impact test strength.

Schematic
-
1Hammer
-
2Distance from the hammer rotation center to the hammer center of gravity (R)
-
3Angle which the hammer swings to after fracturing the test piece (θβ)
-
4Test piece (b: width, h: thickness)
-
5Angle the lifted hammer is lifted to (θα)
Formula
E = WR(cosθβ − cosθα) − L
a = E/bh
E: Absorbed energy (J)
a: Charpy impact value (kg-cm/cm2)
W: Hammer weight (N)
R: Distance from the hammer rotational axis center to the hammer center of gravity (m)
θβ: Angle which the hammer swings to after fracturing the test piece (°)
θα: Angle the hammer is lifted to (°)
b: Test piece width (cm)
h: Test piece thickness (cm)
L: Energy loss caused by friction
Test Pieces Used in the Charpy Impact Test
The following test pieces are used in the Charpy impact test. The test piece is cut out from the same material that is actually used in the product.
| Test method | Test piece |
|---|---|
|
Test method
Method for Charpy impact test of metallic materials
|
Test piece
Charpy impact test piece (V-notch, U-notch)
|
|
Test method
Method for Charpy impact test of carbon fiber reinforced plastics
|
Test piece
Test piece for flatwise impact
Test piece for edgewise impact |
|
Test method
Method for Charpy impact test of glass fiber reinforced plastics
|
Test piece
Charpy impact test piece
|
|
Test method
Plastics−Determination of Charpy impact properties
|
Test piece
Charpy impact test piece
|
Edgewise impact method using a V-notch test piece
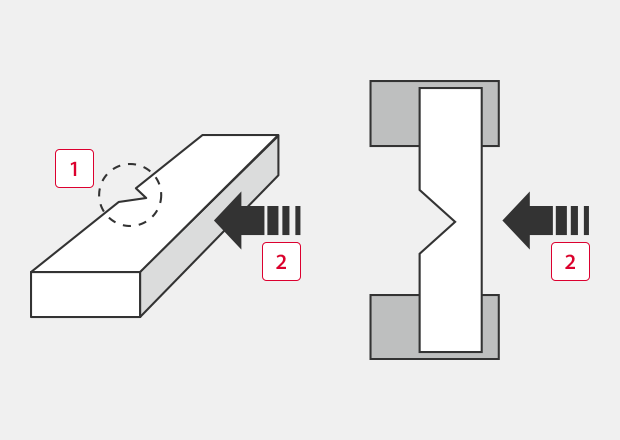
Each test piece has an indentation called a notch which is created in order to concentrate stress. There are two notch types: V-notch and U-notch. The test pieces used for edgewise impact are different from those used for flatwise impact. Edgewise impact is applied to a narrow surface of the test piece, while flatwise impact is applied to a large surface of the test piece. The following figures show the test piece and impact direction when the test piece is subjected to an edgewise impact.
-
1Notch
-
2Impact direction (edgewise method)
Fracture Surface Evaluation at the Charpy Impact Test
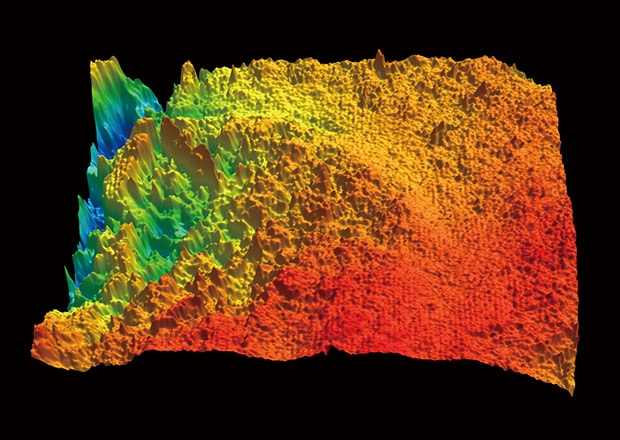
The fracture surface of a test piece that was fractured at a Charpy impact test shows different fracture characteristics depending on the temperature. The change in fracture surface appearance resulting from a change in temperature is referred to as the ductile-to-brittle transition.Fracture surfaces are classified as brittle fracture surfaces or ductile fracture surfaces. Brittle fracture surfaces are shiny silver-white surfaces. Ductile fracture surfaces are dark gray, and are characterized by large deformation and surface irregularities. The percentage of brittle fracture surface out of the entire fracture surface is called the percent brittle fracture. Conversely, the percentage calculated by subtracting the percent brittle fracture from 100% of the fracture surface is called the percent ductile fracture.
For example, when a material is tested at low temperature, the test piece nearly always fractures while mostly maintaining its original square cross-section shape. The fracture surface shows a brittle fracture, indicating that the amount of absorbed energy is small. When the same material is tested at high temperature, a ductile fracture surface is formed and the percent brittle fracture is lower. The amount of absorbed energy also increases.
As described above, the relationship between temperature and absorbed energy, and the change in toughness, can be seen in the surface areas and roughness of the fracture surfaces at the Charpy impact test. This test is therefore very important for quantitative evaluations of these factors.
Differences Between the Charpy Impact Test and Izod Impact Strength Test
In addition to the Charpy impact test, the Izod impact strength test is also commonly used in the industrial fields. This impact test is often used for plastics and the units are J/m. These two methods fasten the test pieces in different ways. In the Charpy impact test, the test piece is fixed at both ends and the impact is applied to the center of the test piece. In the Izod impact strength test, the test piece is fixed at one end and the impact is applied to the other end. As in the Charpy impact test, the impact is applied using a hammer. The impact strength which fractured the test piece is calculated from the absorbed energy. In the same way as the Charpy impact test, absorbed energy is measured by measuring the angle which the hammer is lifted to and the angle which the hammer swings up to as a result of inertia after fracturing the test piece. Izod impact strength and absorbed energy can be calculated using the following formulas.
a = E/b
a: Impact strength (J/m)
E: Energy required for fracture (absorbed energy) (J)
b: Width of test piece on notched side (m)
The formula for calculating absorbed energy is the following.
E = WR(cosθβ − cosθα) − L
E: Absorbed energy (J)
W: Hammer weight (N)
R: Distance from the hammer rotational axis center to the hammer center of gravity (m)
θβ: Angle which the hammer swings to after fracturing the test piece (°)
θα: Angle the hammer is lifted to (°)
L: Energy loss caused by friction
-
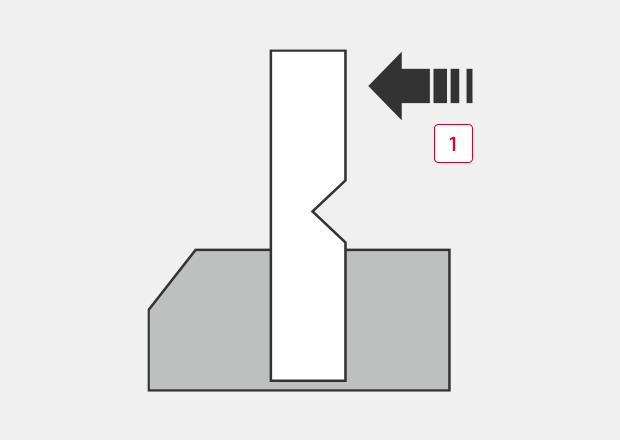
1Impact direction
Problems in Conventional Fracture Surface Measurement
Conventional surface area measurement is performed using a microscope. However, this involves the problems of long measurement time and the inability to quantify the results. Furthermore, the measurement results cannot be stored or digitalized in some cases, which makes fracture surface evaluation extremely difficult.
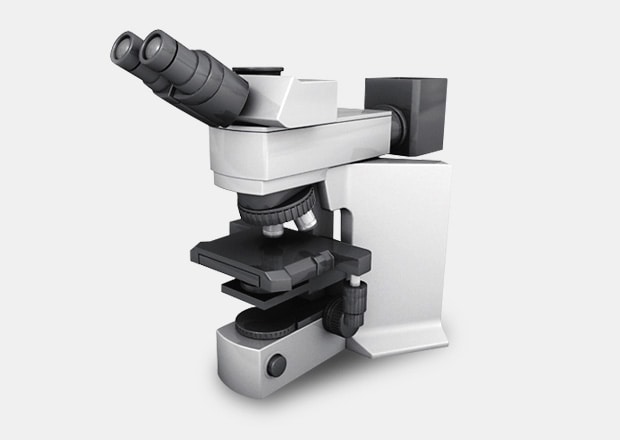
Measurement Difficulties - Microscope
Microscopes acquire information from a surface. It is possible to measure groove widths from the amount of stage movement, and depths from the amount of focus change. Microscopes also provide high magnification, enabling detailed observation of the fracture surface.
At the same time, measurements depend on human eyes, which results in variation in measurement results depending on the operator. An additional concern is that because microscopes are not originally intended for measuring, it may not be possible to quantify the measurement results, or the reliability of the quantified measurement values may be low.
Fracture Surface Measurement Solutions
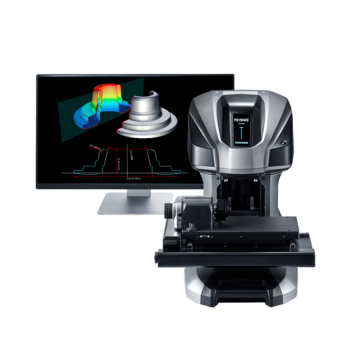
Measurement using conventional microscopes involves problems such as variation in measurement results and an inability to quantify the measurement results. To resolve these measurement problems, KEYENCE has developed the Wide-Area Optical Profiler VR-6000 Series.
The VR-6000 Series accurately captures the 3D shape of the entire target surface without contacting the target. It also measures the 3D shape by 3D-scanning the target on the stage in as little as one second. It is capable of instantaneous and quantitative measurement with no errors in the measurement results. This section introduces some specific advantages of the VR-6000 Series.
Advantage 1: Quantitative Evaluation Is Possible in as Little as One Second
It is possible to measure surface area and volume of a metal fracture surface, as well as the ratio of cross-section area to surface area. Because a wide area can be measured with a single measurement in as little as one second, this makes it possible to achieve a large increase in the number of measurement samples. This is difficult with conventional microscopes and measuring instruments due to the long time required for measurement.
The VR-6000 Series can also measure the maximum and minimum points over a wide area, something which previously required much time and effort. All measurement results are digitalized, significantly reducing the work required for subsequent data comparison and analysis.
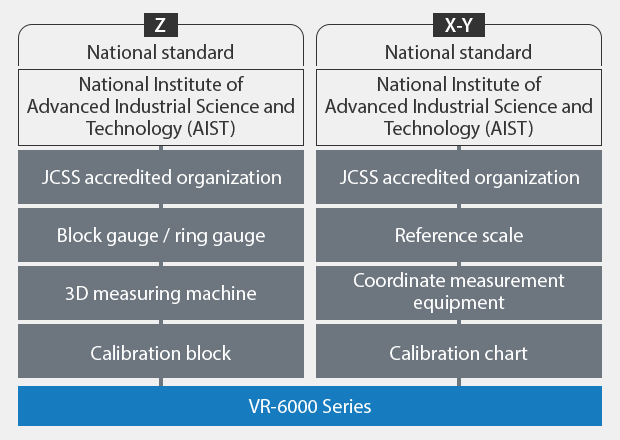
Advantage 2: The Measurement System Supports Traceability
The VR-6000 Series is a non-contact 3D measuring instrument that ensures traceability to national standards. Measurement accuracy performance is guaranteed for both accuracy and repeatability, producing highly reliable measurement results that you can trust. Calibration certificates are provided as standard with the main unit and calibration board.
As described above, the VR-6000 Series is a measurement system that provides full traceability which allows it to be used as a measurement system.
A calibration gauge that includes an inspection report and calibration certificate is also provided as standard. The gauge is linked to the reference scale used by JCSS certification laboratories. As a result, users can easily carry out calibration on-site.
Summary: Quantitative Measurement of Fractured Surfaces
Conventional instruments are only capable of observation, and quantifying results are difficult, time consuming, and inaccurate. The VR-6000 Series allows measurement to be performed quickly, and delivers quantified results. This makes it possible to evaluate fracture surfaces at the Charpy impact test with a higher level of accuracy and efficiency. Of course, the system can also be used to evaluate fracture surfaces at the Izod impact strength test.
- Surface area, volume, and roughness of the fractured surface can be quantified.
- No measurement variation between different operators.
- Without the need for positioning or other preparation, measurement can be done simply by placing the target on the stage and pressing a button. This eliminates the need to assign a specialized operator for measurement work.
- 3D shapes can be measured easily at high speeds with high accuracy. This makes it possible to measure a large number of targets in a short time, helping to improve quality.
This system also allows comparisons with past 3D shape data, as well as easy data analysis such as roughness distribution. It can be used effectively for a wide range of purposes including trend analysis of fracture surface characteristics resulting from temperature changes, and checking the fracture conditions.