Improved Profitability Through Visualization and Early Upstream Action
Improving profitability through the visualization of production processes
People at manufacturing worksites are moving away from inspections that find defective workpieces and toward inspections that lead to problem resolution. These days, manufacturing does not just require inspections. It requires the identification of problems in production processes and early improvements through the visualization of inspection information. Here, we will inspect the effects of improved profitability through the visualization of inspection information in production processes under the title of improved profitability through visualization and early upstream action.
The IoT in the manufacturing industry
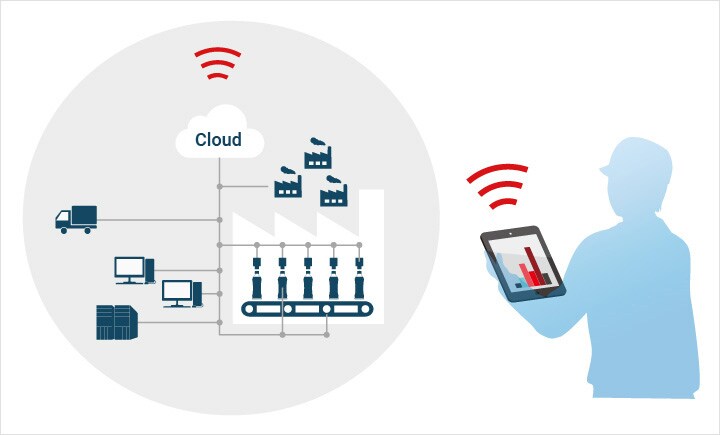
The IoT (Internet of Things) has become a key concept in realizing visualization at production worksites. The IoT refers to mechanisms for and the general concept of connecting various things over the Internet in order to exchange information and perform mutual control.
The networking of production worksites has spread in recent years. Starting with international facilities, global networks are also expanding, which has made the sharing of information more complicated. As a way to perform integrated management of this varying information, the need for the IoT is increasing.
Introducing the IoT into manufacturing worksites enables batch management of the information of various sensors and equipment, the information for the arrival and shipping of products, and the results of inspections in each process; the obtaining of inspection information from within the factory in real time; and the associating of these various types of information. The result is that investigations to determine the causes of problems become smooth. This makes it possible to move away from inspections that find defective workpieces and toward inspections that lead to problem resolution.
In order to realize the IoT, it is first necessary to share information from production worksites (that is, to make this information visible). This is because it is not possible to realize the IoT for the entirety of a factory or company without the on-site inspection information on which production control and traceability guarantees are based. This is where inspections using image processing systems express their capability. With an image processing system, there is no need to manually enter the inspection results. These results can be stored in and managed from a database in an efficient manner. The key to realizing the IoT is the linking of image processing systems and databases.
Linking image processing systems and databases
Realizing visualization at production worksites with the IoT reduces the time it takes to perform investigations to determine the causes of problems, thereby stabilizing production and leading to improved profitability. This results in improved production efficiency and safety as well as traceability guarantees, thereby making it possible to capture the trust of business partners and users. Visualization in production worksites through the use of the IoT is effective in improving the quality (Q), cost (C), and delivery (D) of manufacturing.

Realizing the visualization of inspection results with image processing systems
To realize the visualization of production processes, it is necessary to enable the association, saving, management, and (at any and all times) searching for inspection results.
- When and from where were materials and parts received?
- How are materials and parts stored?
- What materials and parts were combined to produce products?
- Who was in charge of different processes and at what times?
- Who was in charge of an inspection and what were its results?
- Are inspection results and inspection images associated?
- What product was shipped and when? As well as other similar questions.
Visualization associates, saves, and manages the people, things, and information involved in production processes, making these items searchable. In other words, it leads to the guarantee of traceability.
However, with tools such as photoelectric sensors and inspection jigs, it is only possible to determine whether inspection results constitute a pass or fail. It is not possible to determine detailed information such as dimensions and shapes with such tools. Because detailed inspection result information cannot be obtained, it is difficult to investigate concrete improvement plans. With inspections that use image processing systems, it is possible to obtain a variety of information such as dimensions, shapes, and character recognition using OCR technology. This information can also be saved and managed easily. Visualization can be realized by associating this detailed information with its corresponding images and performing management over the entirety of the production processes.
Have you ever experienced any of the following problems?
If even one of these issues applies to you, you may be able to improve your profitability by introducing an image processing system.
- We use photoelectric sensors and inspection jigs, but we cannot obtain detailed information.
- We can only obtain pass/fail information from inspections, so we cannot find any clues for improving our processes.
- We use manual input to manage the information that we obtain, which is a hassle.
- We use manual input to manage information, so the possibility of human error exists.
- We manage inspection results and images separately, so it is not possible to simultaneously search for inspection results and images.
Conventionally, in order to manage inspection results and archived images, it was necessary to construct a database independently. However, with “Vision Database (compatible with the CV-X/XG-X Series),” a database designed specifically for KEYENCE image processing systems, inspection results and archived images can be associated and saved for long periods of time, which makes it easy to search for this information with parameters such as the date or lot number. Setting configuration is simple: just connect the machine vision system and PC and select the inspection data to be saved. This software supports the realization of visualization by packaging all the elements that are required in order to convert information into a database, which was conventionally a hassle to perform.
“Vision Database,” a database designed specifically for image processing systems
Easily search for saved data by date
Over one million data entries can be saved, which makes it easy to find the results and image from a given inspection by searching by date.
* The maximum amount of data that can be saved varies depending on the environment used.Management by association with lot numbers and barcodes
OCR technology can be used to perform management by associating images and information such as read lot numbers, barcodes, and 2D codes. It is also possible to perform associations with, manage, and search for kanban data and the barcode search results of other processes, which enables the tracking and tracing of products throughout the entire production process.
Re-tests, analyses, and improvements from past NG product images
It is possible to search for past inspection results and to perform re-tests from NG images. This makes it possible to track down the causes of problems from stored data, which is also effective in improving worksites.
Outputting the monthly NG percentage and detection amount as a report
Inspection results and image data can be associated and analyzed in or output from Excel. Also, monthly reports can easily be created on the basis of the data output from Vision Database.
Example of improved profitability through visualization
This section introduces a formula for easily calculating the profitability improvement that is obtained through visualization realized with an image processing system and the database “Vision Database.” We hope you will use this formula when considering an image processing system and database.
Profitability improvement calculation
Hours required to perform investigations to determine the causes of problems x production burst size during such time x product unit cost x frequency of such investigations = profitability improvement
【①】 hours x【②】 items x $【③】 x 【④】 times = profitability improvement of $【 】 /month
Profitability improvement calculation sheet
| ①Hours required to perform investigations to determine the causes of problems | hours | |
|---|---|---|
| ②Production burst size during such time | items | |
| ③Product unit cost | $ | |
| ④Frequency of such investigations | times | |
profit improvement of $20,000 /month
Please enter a numeric value
{item} is required.
{item} must be a positive values.
{item} must be an integer.
Calculation example
A problem that takes 10 hours for the investigation into its cause occurs twice a month. With one such problem, the production of 1,000 products (each having a unit cost of $1) is delayed. What sort of profitability improvement would be obtained by implementing countermeasures quickly with visualization?
10 hours x 1,000 items x $1 x 2 times = $20,000/month
The monthly profitability improvement is $20,000!


![A Technical History of Image Processing Vol.1 [Camera]](/img/asset/AS_46814_L.jpg)
![The Latest Image Processing Applications [Transportation Industry]](/img/asset/AS_71759_L.jpg)

![The Latest Machine Vision Inspections [Food and Medical Industries]](/img/asset/AS_72814_L.jpg)