
ISO/IEC 15416 Verification Method
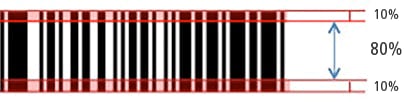
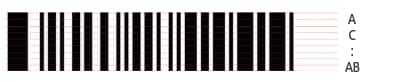
10 scans worth of verification data are obtained every 8%.

The range of grades is A, B, C, D, F.
| Grade | Numeric value |
|---|---|
| A | 4.0 |
| B | 3.0 |
| C | 2.0 |
| D | 1.0 |
| F | 0.0 |
The grade of each scan is converted to a numeric value according to the table on the left.
| Scan | Grade | Numeric value |
|---|---|---|
| 1 | A | 4.0 |
| 2 | A | 4.0 |
| 3 | B | 3.0 |
| 4 | B | 3.0 |
| 5 | A | 4.0 |
| 6 | A | 4.0 |
| 7 | C | 2.0 |
| 8 | F | 0.0 |
| 9 | D | 1.0 |
| 10 | A | 4.0 |
Average: 2.9
The average is calculated from the grades of the data from 10 scans. Then, this average is further classified into a grade according to the total grade judgment table.
In the example shown in the table on the left, the average is 2.9.
| Average | ISO/IEC 15416 total grade |
|---|---|
| 4.0 to 3.5 | A |
| 3.4 to 2.5 | B |
| 2.4 to 1.5 | C |
| 1.4 to 0.5 | D |
| 0.4 to 0.0 | F |
The total grade is determined for the calculated average according to the table on the left.
In this example, the average is 2.9, so the grade is “B.”

