
Sampling Inspections
Two types of quality inspections are conducted on production lines: 100% inspection and sampling inspection. Inspecting every single part that is produced in massive quantities at low cost, such as nuts and bolts, light bulbs, and electronic parts, can dramatically increase labor and costs, making that approach neither economical or nor realistic. 100% inspection is also not viable in cases where inspection may break the product. Therefore, 100% inspections are generally adopted for life-supporting products, expensive products, and products that are not consumed or damaged by inspection. This means that a variety of products undergo sampling inspections in different processes.
- Characteristics of Sampling Inspection
- Sampling Inspection and Production Processes
- Sampling Inspection Schemes
- Determining the Sample Size for Sampling Inspection with Adjustment
- Using Sampling Inspection to Prevent Nonconforming Products from Being Released
Characteristics of Sampling Inspection
In sampling inspection, samples are taken from a target lot (inspection lot) for examination in order to determine the acceptability of the lot according to that lot’s quality standards. Thanks to the small number of items to be inspected compared to 100% inspection, manufacturers can save on inspection costs and time. Sampling inspection also allows for the examination of a number of test items that cannot otherwise be inspected in 100% inspection.
However, sampling inspections do not guarantee the quality of all manufactured products. Therefore, sampling inspections need a system that cuts inspection costs while taking into consideration the manufacturer’s and consumers’ benefits, while reducing the risk of nonconformity to ensure consistently high quality. This means that the inspection scheme and how the appropriate sample size for the manufacturing process is determined are very important.
Sampling Inspection and Production Processes
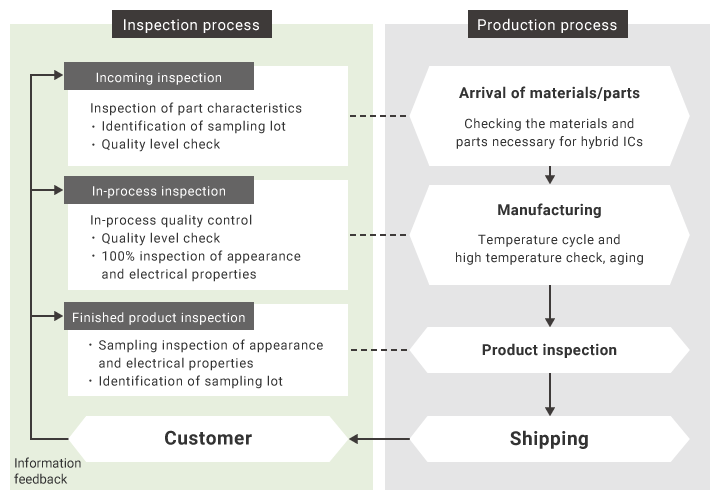
The following diagram shows the relationship of the production and inspection processes for electronic components. As shown here, the production process and inspection process are intricately coordinated from acceptance to manufacturing and shipping. Various sampling and 100% inspections are conducted in each sub-process.
Sampling Inspection Schemes
Sampling inspections can be categorized into several groups based on the location where the inspection takes place, purpose of inspection, characteristics, and method. In addition to location or purpose-based categorization, including incoming inspection, shipment inspection, and delivery inspection, sampling inspections can also be distinguished depending on the products being handled, such as finished product inspection, semi-finished product inspection, parts inspection, and material inspection. This section introduces the most common sampling inspection classifications and inspection schemes.
Classification by inspection scheme
- Lot-by-lot sampling inspection
- Controlled sampling inspection
In lot-by-lot sampling inspection, a specified quantity of samples are taken for inspection from the lot of products manufactured using the same materials and equipment. The result of the quality inspection of the samples determines whether or not that lot’s quality is acceptable. In general, sampling inspection refers to this type of lot-by-lot inspection.
In controlled sampling inspection, a small number of products are sampled for inspection from various parts of the manufacturing process in order to manage the conditions of the process. This inspection serves the purpose of examining the conditions of a process and is also called process inspection or spot checking.It is conducted for specific management, such as to create a management diagram for use in quality control or to acquire data for cycle time examination. While other sampling inspections focus on the products, controlled sampling inspection is conducted to examine machines, systems, operators, or operating methods. This helps with early discovery and correction of any problems in operations, equipment, or systems. Therefore, controlled sampling inspection does not typically need as many samples as other sampling inspections.
Classification by acceptance level determination
- Sampling inspection based on operating characteristics
- Sampling inspection with adjustment
- Rectifying inspection
- Sampling inspection for continuous production
Sampling inspection based on operating characteristics is an inspection plan that defines the producer protection and guarantee for purchasers, and also meets the demands of both the producer and purchasers. For the producer, this sampling scheme provides protection by establishing a certain small value as the percent of good-quality lots erroneously being rejected (producer’s risk). On the other hand, this sampling scheme provides safety to purchasers by establishing a certain small value as the percent of poor-quality lots erroneously being accepted (consumer’s risk). As a basic rule, producer’s risk and consumer’s risk are set to 5% and 10%, respectively, which can be observed on an OC curve.
Sampling inspection with adjustment adjusts the guarantee of quality to purchasers by reducing or tightening the sampling inspection based on past inspection quality records. Sampling inspection with adjustment can be indexed by AQL or LQ, or be conducted as a skip-lot inspection plan. The sampling procedure for inspection with adjustment is defined in ISO 2859-1, ISO 2859-2, and ISO 2859-3.
In a rectifying inspection, a lot that has been rejected in a sampling inspection is subjected to a 100% inspection. For this reason, this scheme is not applicable to products that are not suitable for 100% inspections.
Sampling inspection for continuous production is an inspection scheme that sequentially inspects products that are continuously manufactured instead of by lots. The sample inspection plan can be something like starting out with 100% inspection and then changing over to sampling inspection after a certain number of consecutive conforming products. If a nonconformity is found, the mode of inspection returns to 100% inspection.
Classification by sampling plan
- Single sampling inspection
- Double sampling inspection
- Multiple sampling inspection
- Sequential sampling inspection
Single sampling inspection determines the acceptability of a lot based on the result of one sampling inspection.
Double sampling inspection determines the acceptability of a lot based on the result of a second sampling inspection when it is unclear from the result of the first inspection whether the lot is accepted or rejected.
Multiple sampling inspection uses an increased number of samplings compared to a double sampling inspection scheme. A certain number of items are sampled each time and the result is compared with the specified standard. This mode of inspection determines acceptance or rejection by the specified inspection count while sorting results into acceptable, not acceptable, and uncertain.
Sequential sampling inspection determines acceptability in further detail in a multiple sampling inspection scheme. Sequential sampling inspection can be conducted in either of the following two ways: individual sequential inspection, in which a single item is sampled, and grouped sequential inspection, in which a fixed number of items are sampled at a time.
Determining the Sample Size for Sampling Inspection with Adjustment
Sampling inspection with adjustment has three different ways of determining the sample size:
- AQL indexing
- LQ (Limiting quality) indexing
- Lot skipping
- AQL indexing
- AQL is a short for acceptance quality limit. It is the upper limit of accepting products in a sampling inspection and is a commonly used inspection standard for sampling inspections. In an AQL-indexed sampling inspection, if the quality of products from a process where the samples are taken does not fall below the AQL, those products are likely to be acceptable.
- LQ indexing and lot skipping
- LQ indexing and lot skipping differ from AQL indexing in terms of the index used for determining the quality level and the sampling approach. For example, LQ-indexed sampling inspection uses the limit quality (LQ) as the index. Sampling inspection that skips lots deems some sequential lots acceptable without inspection, provided that a certain number of lots have met the standard.
This section explains the basics of sampling plans indexed by AQL, which is the most common scheme for sampling inspections. This mode of inspection uses a sampling scheme defined in ISO 2859-1 and first checks the sample letter and then determines the sample size. Through this procedure, you can understand how the inspection standard and strictness are selected, how to determine the sample size, and how to check the acceptable and rejected numbers.
Checking the sample letter
The number of samples to take from a lot is indicated by an alphabetical code called a sample letter, which is established as shown in the table below based on lot size and inspection level (ISO 2859-1).
| Lot size | Special inspection levels | General inspection levels | |||||
|---|---|---|---|---|---|---|---|
| S-1 | S-2 | S-3 | S-4 | I | II | III | |
| 2 to 8 | A | A | A | A | A | A | B |
| 9 to 15 | A | A | A | A | A | B | C |
| 16 to 25 | A | A | B | B | B | C | D |
| 26 to 50 | A | B | B | C | C | D | E |
| 51 to 90 | B | B | C | C | C | E | F |
| 91 to 150 | B | B | C | D | D | F | G |
| 151 to 280 | B | C | D | E | E | G | H |
| 281 to 500 | B | C | D | E | F | H | J |
| 501 to 1200 | C | C | E | F | G | J | K |
| 1201 to 3200 | C | D | E | G | H | K | L |
| 3201 to 10000 | C | D | F | G | J | L | M |
| 10001 to 35000 | C | D | F | H | K | M | N |
| 35001 to 150000 | D | E | G | J | L | N | P |
| 150001 to 500000 | D | E | G | J | M | P | Q |
| 500001 and over | D | E | H | K | N | Q | R |
The sample letter is a code that indicates the sample size used for convenience when considering the sampling inspection scheme. The sample size is determined based on this letter.
For inspection level, “General inspection level II” is selected as long as there is no problem with the process. For lot size, select the lot size of the inspection target. The sample letter is determined based on the inspection level and lot size.
For example, a lot size of 2000 and a general inspection level of II gives the sample letter K.
Determining the sample size
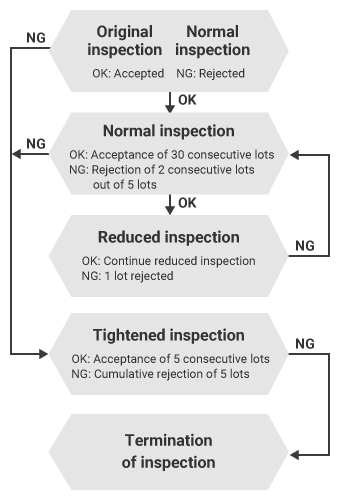
Use the sample letter to determine the sample size. The strictness of the inspection is determined by the sample size. Inspection strictness is divided into the following levels:
- Normal inspection
- Reduced inspection
- Tightened inspection
First, based on the conditions of the current process, select one of the above three inspection strictness levels. Then, refer to the sampling plans (master table) for the selected level.
This table is defined for each combination of inspection strictness and sampling plan. Normal inspection is usually used if there is no problem present in the process. For example, if the inspection scheme is single sampling plan for normal inspection, refer to the following table specified by ISO:
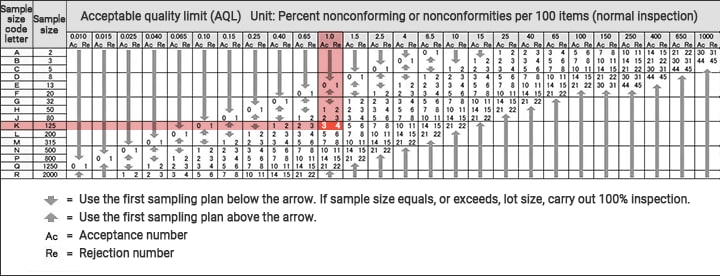
For the example provided under “Checking the sample letter,” the sample letter is K and the sample size is 125 units. If the percent nonconforming is 1.0%, the acceptance sample (As) is 3 and the rejection sample (Rs) is 4. This means that the lot is accepted when there are three or less nonconforming items. The same lot is not accepted when there are four or more nonconforming items in this inspection.
Precautions for determining the lot size
In sampling inspection, samples selected from manufactured products are subjected to inspection. Products are inspected by lot, and the inspection results from the individual lots are used as valuable information that shows the trend of the changes in the process in continuous production. Therefore, it is necessary to complete inspections as soon as possible and provide the results as feedback to the work floor.
How a lot is defined varies depending on the company. The definition of lot affects the number of samples. If the lot size is small, items are frequently sampled, which can make inspections cumbersome. If the lot size is large, it can lead to a potential problem of having more products suspended from shipment in case a quality issue arises. Therefore, it is necessary to establish upper and lower limits when choosing an appropriate lot size. The lot size must also consist of products manufactured under the same conditions, which should be based on a good understanding of the operating status of the production process.
Using Sampling Inspection to Prevent Nonconforming Products from Being Released
In order to prevent nonconforming products from passing inspections, the acceptance and rejection rates of the current inspection scheme must be clarified. The operating characteristic (OC) curve is a graph that visualizes these rates. Also called the inspection characteristic curve, this curve differs depending on the inspection scheme and level, and is used to determine the lot size and sample size for a sampling inspection.
An OC curve places the lot’s acceptance rate on the vertical axis and the product rejection rate on the horizontal axis. As a result of sampling inspection, a lower nonconformity rate increases the acceptance rate while a higher nonconformity rate decreases the acceptance rate. The graph draws a gentle curve running from top left to bottom right.
This section will explain the basics of how to read an OC curve and how an OC curve can prevent nonconformities from being released to market.
What an OC curve can show
Here, we will use a sample OC curve for a case where a sampling inspection conducted on 10 samples taken from 1000 products will pass that lot if there is no more than one nonconforming product (1% rejection rate).
As the result of inspection, various patterns can be considered, ranging from all samples being nonconforming to all samples being good. The graph below shows the OC curve representing this relationship.
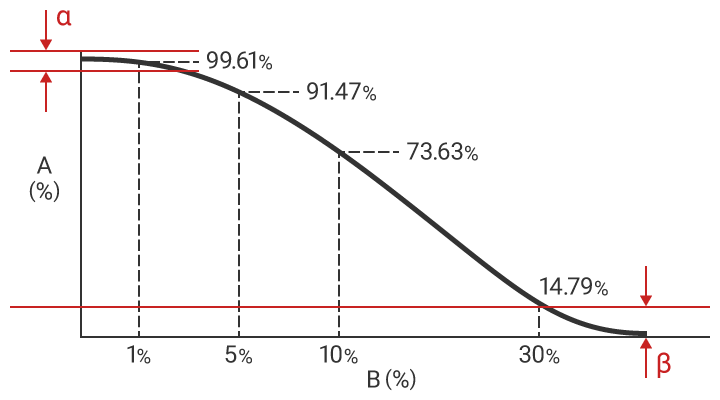
- A
- Acceptance rate
- B
- Rejection rate of the lot
- α
- Producer’s risk
- β
- Consumer’s risk
You can see the following characteristics of the inspection scheme from this OC curve:
- The probability of a lot with a rejection rate of 1% passing this inspection is 99.61%.
- The probability of a lot with a rejection rate of 5% passing this inspection is 91.47%.
- The probability of a lot with a rejection rate of 10% passing this inspection is 73.63%.
- The probability of a lot with a rejection rate of 30% passing this inspection is 14.79%.
What is notable here is that 14.79% of lots with a 30% rejection rate will pass the inspection. On the other hand, there is also a possibility that lots that should actually pass could be rejected. In response to this issue, ISO establishes a 5% producer’s risk (α: probability of rejecting a lot with a proportion of nonconforming units that is below the acceptable quality level) and a 10% consumer’s risk (β: probability of accepting a lot with a proportion of nonconforming units that is above the acceptable quality level).
Determining the optimal sample size from an OC curve
As long as only the products that are sampled are actually inspected, there is always the chance of nonconforming lots being shipped. However, it is possible to lower the likelihood of nonconforming lots being shipped.
Increasing the sample size while keeping the acceptance and rejection level the same can help minimize the risk of nonconforming lots being shipped. For example, if you increase the inspection quantity to 20, the probability of this lot with a 30% rejection rate passing the inspection is reduced to 3.41%. The following is an OC curve for a case where the inspection quantity is increased to 20.
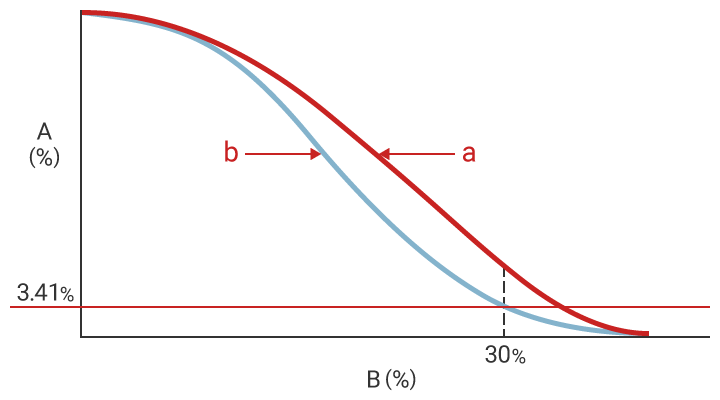
- A
- Acceptance rate
- B
- Rejection rate of the lot
- a
- Inspection with 10 samples
- b
- Inspection with 20 samples
As you can see here, increasing the number of samples can improve the quality of the shipment lots. However, a larger sample size also increases inspection time. Increasing the sample size is particularly difficult in cases where the products can break during the inspection.
While the optimal sample size is determined by economical inspection labor time and desired quality, the OC curve is a tool that represents the balance between the two.
The Mathematics of OC Curves
Why does the OC curve take this form?
If the rejection rate is 0, and a lot can pass the inspection if its acceptance rate is smaller than its rejection rate (and fails when the acceptance rate is greater), it leaves no room for any nonconformities to be released on market. However, the only way to achieve that is by implementing 100% inspection.
Sampling inspection is simply a means to prevent nonconforming products from being shipped by using probability. It allows us to consider a way to minimize nonconformities in the market.
The probability P(r) of n samples including r nonconforming products can be calculated as follows:

Showing a binomial distribution, the probability P(≦r) of the number of nonconforming products being r or less is:

Here, when you have fixed values for n and r, P(≦r) is a function of p (acceptance rate), then you have P(p) in place of P(≦r), and the curve drawn by this function is the OC curve.