Useful Functions for Analysis
To take advantage of the functions of a data logger and reduce the man-hours required for analysis, you should effectively utilize analysis software. “WAVE LOGGER PRO,” a piece of analysis software made by KEYENCE, offers functions for improving the efficiency of measurement and instrumentation. This software is also equipped with other functions, such as those used for comparing data files and writing/compressing data.
This section introduces various useful functions of WAVE LOGGER PRO, a piece of software that significantly reduces the time and work required for analysis.

Useful functions for measurement and instrumentation
If you want to intuitively set measurement while viewing a waveform
A window for setting measurement conditions is displayed under the waveform.
If you change a setting, the change is reflected in real-time so that you can intuitively and quickly determine measurement conditions.
STEP 1
Click [Main unit setting/operations] − [Adjustment mode].
![-> In Excel, click [Tools] − [Macro] − [Visual Basic Editor].](/Images/d_function_001_1878009.gif)
The adjustment mode will start.
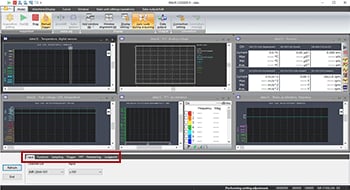
Available tabs
- Input
- Function
- Sampling
- Trigger
- FFT
- Hammering
- Judgment
STEP 2
![When you are finished, click [Exit].](/Images/d_function_003_1878011.gif)
When you are finished, click [End].
Additional info
This function is effective when the magnitude of input signals and the level of triggers are not clear.
The display conditions (such as the aspect ratio) can be changed at any time using the enlarge/shrink button on the toolbar.
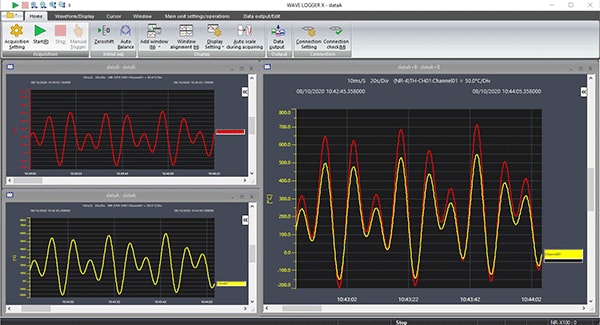
If you want to observe data and compare it with past data during measurement
You can open past measured data during measurement.
This function is useful, for example, for comparison against a reference waveform. You can open any number of pieces of saved data.
STEP 1
Select [File] − [Waveform data] − [Load waveform data] − [Load from file] to open a waveform data file.
![Select [File] − [Read waveform data] to open a waveform data file.](/Images/d_function_004_1878012.gif)
The past reference waveform will be read.
STEP 2
Select [Sort Horizontally] or [Sort Vertically].
![Select [Tile horizontally] or [Tile vertically].](/Images/d_function_005_1878013.gif)
- [Sort horizontally]
- [Sort vertically]
STEP 3
Observe and compare the target point.
Additional info
The cursor function is useful for accurately reading the value of the point to compare.
You can read the information of the point where the cursor is positioned as digital numeric values.
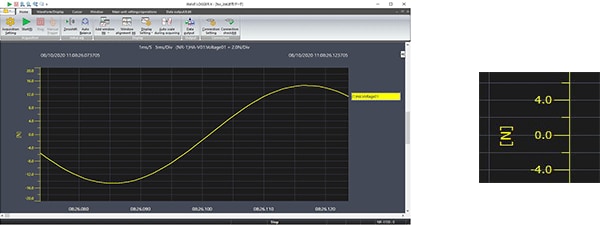
If you want to convert measured values to physical values and display the converted values together with their unit
This function is useful when you want to convert instrumentation signals such as 0 to 5 V and 4 to 20 mA to physical values and output them in units such as “atm” and “kgf.”
STEP 1
Click [Measurement Configuration].
STEP 2
Click [CH detail setting].
![Click [Channel Display Configuration].](/Images/d_function_006_1878014.gif)
STEP 3
Set the scaling for the relevant channel.
Additional info
If you save CSV data, the values after scaling are saved.
If you transfer data to spreadsheet software together with the waveform display, the values before scaling are transferred.
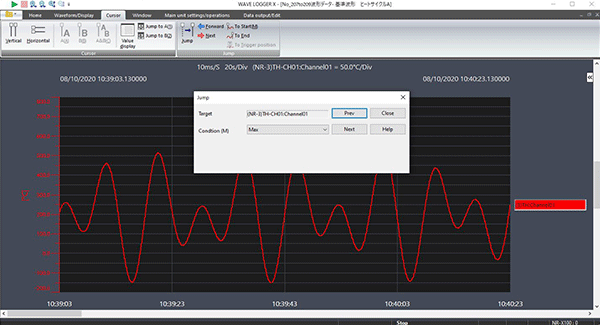
If you want to search for specific parts such as maximum, minimum, and mark positions
You can instantaneously search for characteristic parts in measured data.
There are 12 types of search categories including maximum, minimum, and mark positions.
STEP 1
Click the waveform window you want to search.
STEP 2
Select [Cursor] − [Jump].
STEP 3
Select a search mode and click [Prev (Next)].
![Select a search mode and click [Previous (Next)].](/Images/d_function_009_1878017.gif)
![Select a search mode and click [Previous (Next)].](/Images/d_function_010_1878018.gif)
Additional info
If you save CSV data, the values after scaling are saved.
If you transfer data to spreadsheet software together with the waveform display, the values before scaling are transferred.
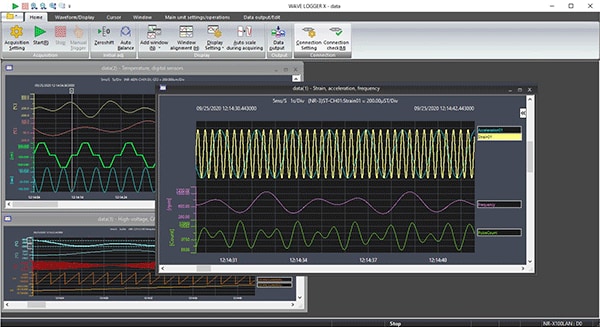
If you want to compare two different data files by laying one over the other
To check event changes, you can compare data files obtained at different times.
This function enables a comparison just like looking through two overlaid pieces of record paper.
STEP 1
Open the two files you want to compare.
STEP 2
Activate the comparison source window and select [Data output/Edit] − [Import Waveform].
STEP 3
Select and import the desired waveform file and channel.
Additional info
The import function is used when comparing different files.
Meanwhile, the overlaying function is useful for monitoring waveform changes by using triggers after a simultaneous start and repeating measurements under the same conditions.

Useful operation procedures
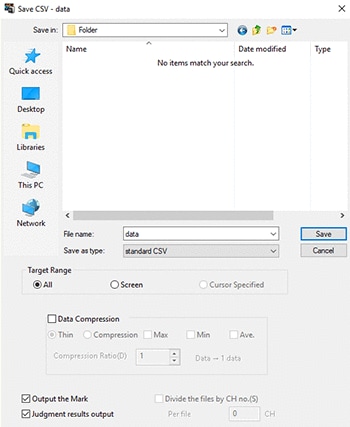
If you want to compress a large amount of data when saving it
Each piece of spreadsheet software has its own limit on the volume of data it can handle.
For example, Excel has a limit of 65536 rows of data.
Data compression is useful if the data volume exceeds the limit.
STEP 1
Select [Data output/Edit] − [CSV output].
STEP 2
Specify the range to save.
STEP 3
Specify the type of data compression processing and save the results.
Additional info
You can also use the data compression function when data is automatically saved or the utility software “FileViewer” is being used.
(However, you cannot set the data range.)
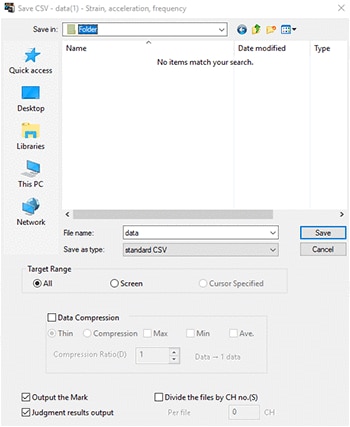
If you want to convert a lot of recorded data to CSV in a batch
There are two data file formats: a dedicated binary format and a spreadsheet software format.
The method to use in converting the binary format to the spreadsheet software format is shown below.
STEP 1
Click the data window you want to convert to activate it.
STEP 2
Select [Data output/Edit] − [CSV output].
![Select [Transfer to Excel / Save as CSV] − [Save as CSV].](/Images/d_function_014_1878022.gif)
STEP 3
Save the results.
If necessary, specify the range of data to save and the compression processing.
This procedure is intended to convert a file of measured data.
CSV-format data files can be obtained through the two ways of conversion shown below.
- Through automatic saving
- Via a dedicated utility
Additional info
The format compatible with spreadsheet software (the CSV format) cannot be opened by the dedicated waveform software.
Also note that the size of a file saved in CSV format is four to five times the size of the file in binary format.
It is recommended that you usually save data in binary format and convert it to CSV format when necessary.
If you want to automate frequently used operations such as measurement start, display, and recording
It is helpful if you can automate a series of operations such as routine inspection or experimentation and analysis using spreadsheet software.
You can easily control the waveform software using macros or programming languages.
STEP 1
Design operations you want to automate.
STEP 2
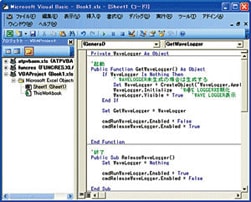
In Excel, click [Tools] − [Macro] − [Visual Basic Editor].
![In Excel, click [Tools] − [Macro] − [Visual Basic Editor].](/Images/d_function_016_1878024.gif)
STEP 3
Program the designed operations using dedicated commands (automation server).
* Sample programs and the operation manual are provided with the recorder software.
Additional info
The automation server functions control the waveform software.
Because this software intermediates between the hardware and the macros, no difficult programming for the hardware is necessary, as is the case when using libraries.
Ultra-high-speed, real-time transfer to Excel
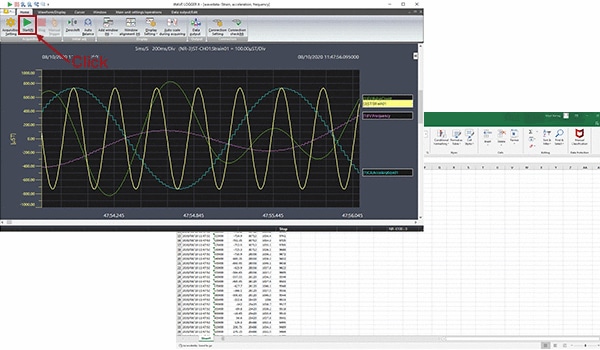
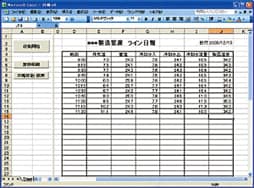
The latest recorders generally save measured data not on paper but as data. Ultra-high-speed, real-time transfer to Excel is an easy-to-use function that transfers data to Excel, a piece of software commonly used for analysis, in real time so that you can write data onto a worksheet. This function significantly reduces the work—such as data conversion, saving, and reading—required for analysis and report creation.
Direct input of measured values into Excel simultaneously with waveform measurement!
- Real-time operation that transfers 65,000 rows of measured data—the limit for real-time transfer—in a mere 10 seconds.
- During offline transfer (data transfer after measurement), data is thinned or compressed to meet the constraint on the number of rows.
- Thinning
- Data is skipped at an optional interval and transferred.
- Compression
- Data is calculated into the average, maximum, and minimum in an optional period before transfer.