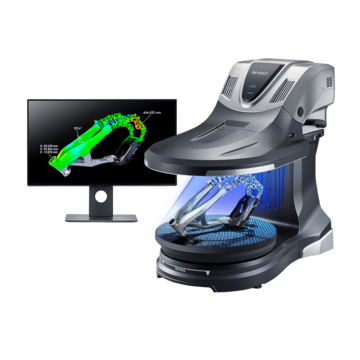
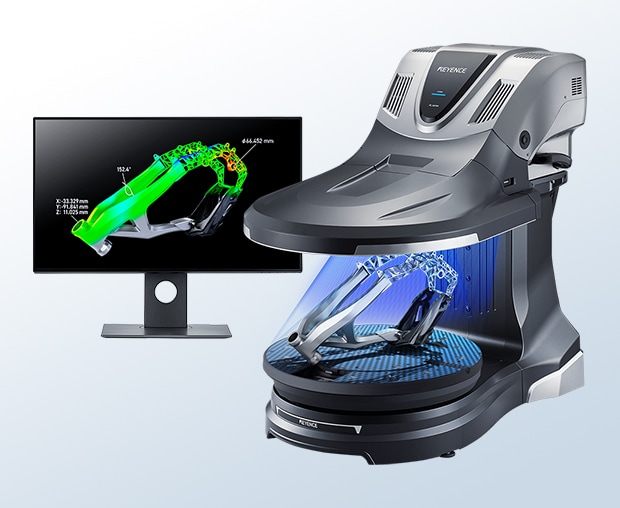
3D Scanner

One of the significant challenges in stamping/pressing is the difficulty in predicting 'springback'. Springback can significantly reduce the accuracy of the product, leading to increased manufacturing costs and decreased production efficiency due to the need for reprocessing and an increase in waste products.
Here, along with technical information on springback, we will introduce in detail the solutions provided by the 'VL Series'.
While incorporating specific examples, we will explain the latest technologies aimed at solving the springback problem.
What is Springback?
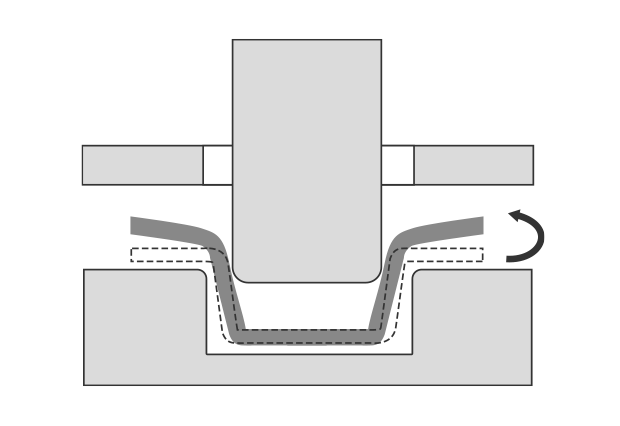
When stamping, the application of a load to a metal material causes it to deform. There are two types of deformation: elastic deformation, where the material returns to its original shape when the load is removed, and plastic deformation, where it does not. The phenomenon where the metal tries to return to its original shape when the load is removed is called 'springback'. 'Springback' occurs due to a complex interplay of many factors, such as material characteristics (elastic modulus, yield stress, hardening index, etc.) and processing conditions (bending angle, bending radius, plate thickness, etc.). Parts that experience unexpected springback after processing will not conform to the intended design due to this deformation.

Importance of Springback Countermeasures
Anticipating the occurrence of 'springback' during the stamping process is crucial and integrating this prediction into the mold design. This involves simulating the pressing process during the development stage and correcting for it. As mentioned at the beginning, springback has a significant impact on dimensional accuracy, so its countermeasures are of high importance. Recently, there has been an increase in the use of high-tensile materials, such as high-strength steel, which are thinner and stronger than conventional steel sheets, particularly in the automative industry. While high-tensile materials offer potential for weight reduction and strength improvement, they also increase the amount of springback.

Challenges with Traditional Measurement Methods
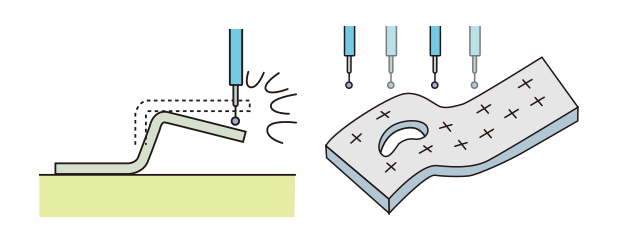
With calipers or CMMs that rely on measuring surfaces using points, it is difficult to thoroughly measure stamped products with complex or non-geometric shapes, particularly if there are areas that are hard to reach. While these measurement devices are very accurate, they are not suitable for calculating the difference between the design and manufactured part for evaluating springback.
VL Series 3D Scanner Solution Examples
Comparison with 3D CAD Data
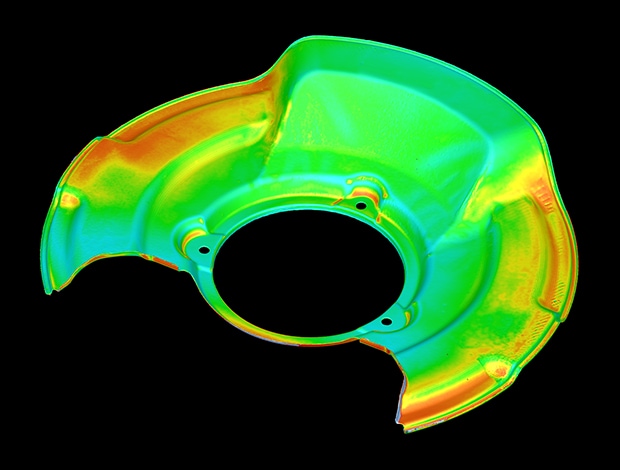
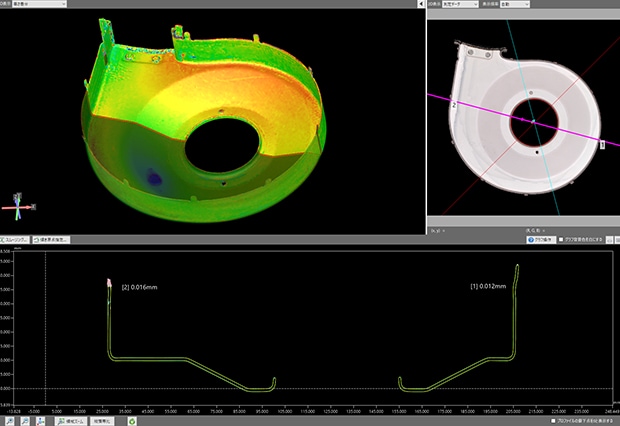
With the VL Series, you can visualize the difference between 3D CAD data and pressed products in a color map. This allows you to quickly identify areas where the actual shape deviates from the design values due to springback. Of course, numerical evaluation is also possible, so you can understand how much correction is needed.
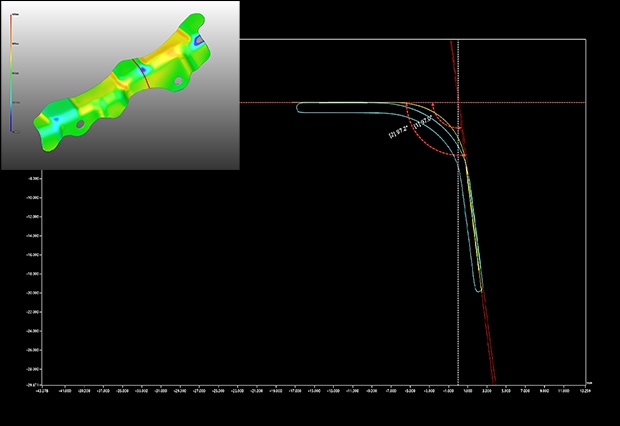
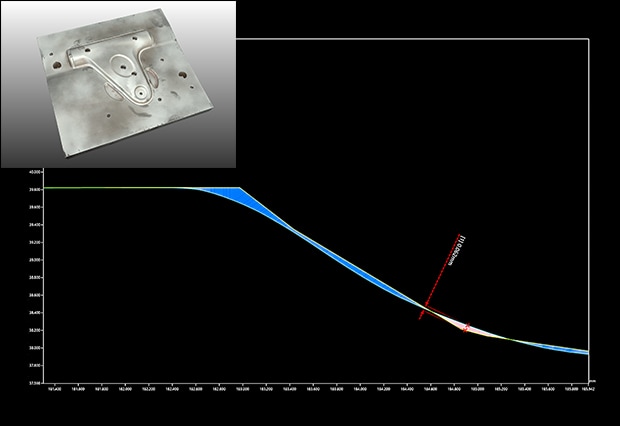
Comparison with 3D CAD Data through Cross-Section Measurement
Once you have visualized the difference with 3D CAD data, further deep analysis is possible. You can 'cut' the pressed product on the data and measure how much the angle differs between the CAD and the actual product. The figure below shows that the actual product (blue) is 0.2° more open than the CAD design value (yellow). By feeding back these results to the mold design, you can significantly reduce the lead time of the traditional trial and error process, which used to take a lot of time, and also reduce costs by keeping material usage to a minimum.
Profile comparative measurement
Other 3D Scanner Applications for Metal Stamping
Thickness measurement
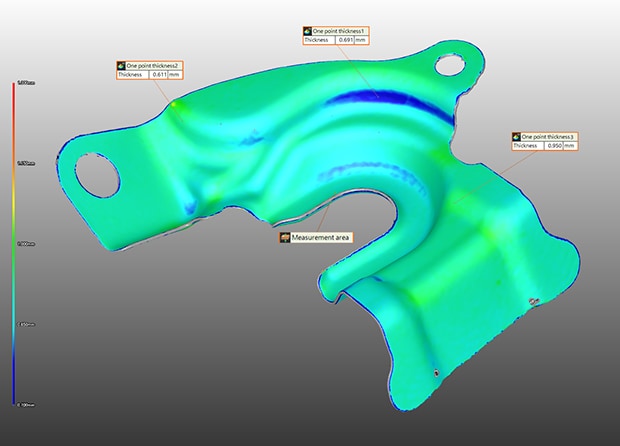
Management of Plate Thickness Reduction
For pressed products, plate thickness is a crucial point that affects quality. If the plate thickness reduction progresses too much, strength and durability deteriorate, causing damage. The VL Series can capture data from all 360° around both the front and back, visualizing the overall thickness distribution in a color map. This allows you to notice immediately if the plate thickness suddenly changes due to material changes.
Profile comparative measurement
Die Wear Management
With the VL Series, you can quantitatively manage dies that have worn out from continued use. By comparing CAD data or initial die data with the worn-out die, you can accurately determine the timing for die replacement or repair. This eliminates concerns about losses from premature replacement or decreased direct run rate due to defects caused by worn-out dies.
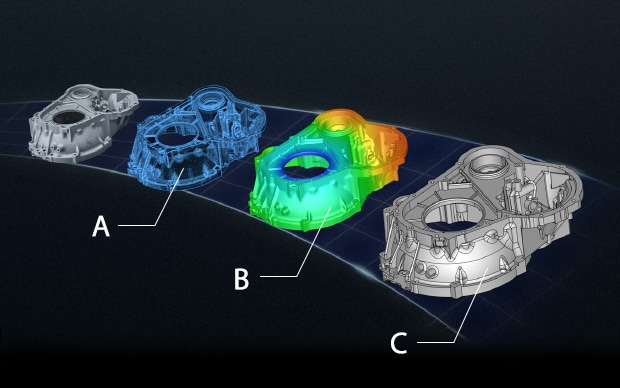
A: Point cloud data B: Polygon data C: CAD data
Reverse Engineering for New Mold Creation
The VL Series proves useful when creating a new mold from an old one lacking drawings. You can digitize the existing physical object and convert it to 3D CAD data with one click. This allows you to design a new mold based on that data, significantly shortening the design lead time. You can also design a mold based on the sample you want to create, so you can quickly respond to requests like "I don't have CAD, but I want to create something like this!"
Discover how the VL Series 3D scanner revolutionizes quality control across industries, ensuring unmatched efficiency and reliability in your measurement processes. Request a demo today!

Summary
Calculation of Springback Amount: By comparing with CAD and looking at the cross-section, you can measure how much the angle differs.
Management of Plate Thickness Reduction: With a 360° full-circle scan, you can capture thickness as a distribution, allowing you to know before a problem occurs.
Die Wear Management: Comparison is possible for each shot count of the mold. You won't miss the timing for adjustments.
Creation of New Molds: With reverse engineering, you can restore molds without drawings as design data.
Get detailed information on our products by downloading our catalog.
View Catalog