3D Optical Profilometers
White Light Interferometers(WLI)
White Light Interferometers
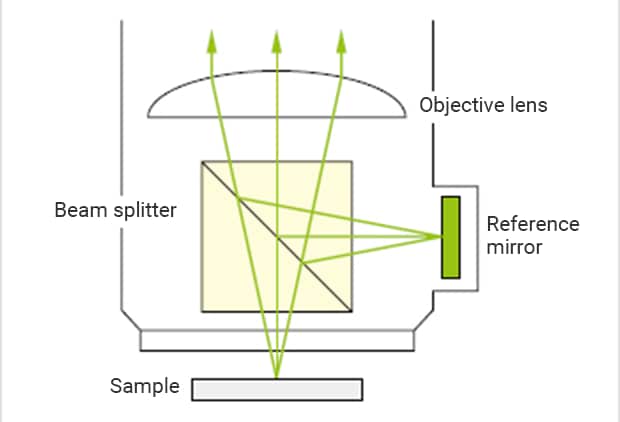
Light interference occurs when two waves of light converge, causing the amplitude of the now combined wave to increase or decrease. White light interferometers use this phenomenon to capture the 3D data of a sample. The figure on the right is a structural diagram of an interferometer. The light emitted from the source is separated into reference and measurement beams. While the reference beam is passed through the reference mirror through a beam splitter, the measurement beam is reflected and guided to the sample surface. The passed beam is reflected by the reference mirror to the CCD image sensor and forms an interference pattern. The other beam is reflected off the sample surface, passes the beam splitter, and forms an image through the CCD image sensor.
The white light interferometer is designed so that the optical path length from the CCD element to the reference mirror and that from the CCD element to the sample surface are the same. The asperity on the sample surface causes these path lengths to be unequal, which results in forming an interference pattern at the CCD element. The number of lines in the interference pattern is translated to peaks and troughs (heights) on the sample surface.
Cause of light interference
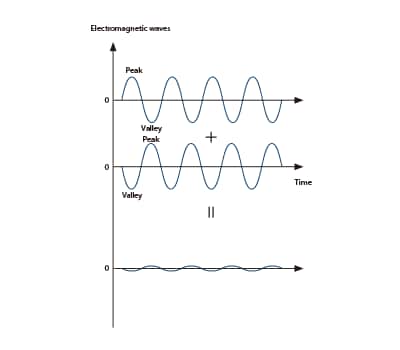
Light interference occurs when two light waves collide, causing each to strengthen or weaken. This section describes the interference of two lights reaching point P at a certain distance from the surface of the target. If the difference in distance between the two light paths S1P and S2P is an integer multiple of the light wavelength λ, the two light waves will strengthen and become brighter at point P due to the wave peaks overlapping. If the optical path difference is an integer multiple of the wavelength λ + 1/2 the wavelength λ, the peaks and valleys of the waves will overlap, causing the waves to weaken and become darker.
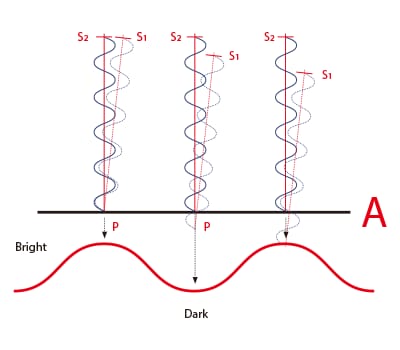
A: Optical path difference = S2P – S1P
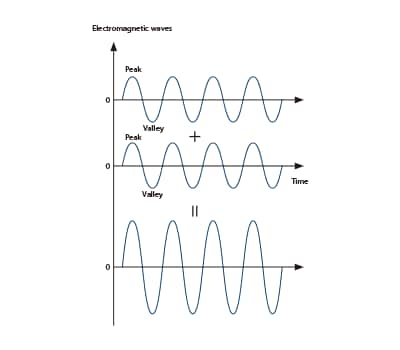
Optical path difference and light interference
When the optical path difference is an integer multiple of the wavelength λ
Strengthening due to peaks overlapping with peaks and valleys overlapping with valleys.
Optical path difference and light interference
When the optical path difference is an integer multiple of the wavelength λ + λ/2
Weakening due to peaks overlapping with valleys.
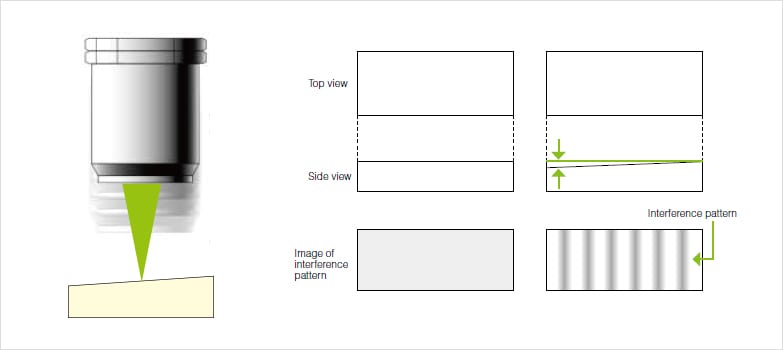
Interference stripes
The interference light becomes lighter and darker at intervals equal to half the wavelength of the light source (λ/2). These patterns of light and dark are called interference stripes. The height of a target can be determined by counting the number of interference stripes.
The physicist Christiaan Huygens and others have proved that interference stripes of light form a graph (waveform) with a fixed period, as in the figure below. Optical interferometers use this physical phenomenon to ensure high-resolution measurement even at low magnifications.
Interference stripe wavelengths
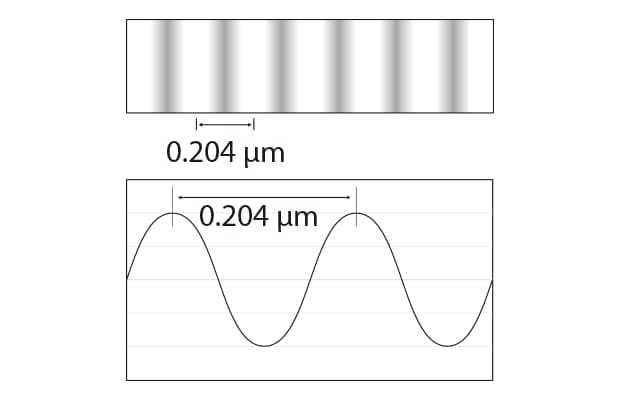
For example, when using a 408 nm light source, the interference stripe spacing (wavelength) is 0.204 μm.
This value represents the height difference of the measured surface.
Because the height difference from peak to peak in the waveform graph is 0.204 μm, a resolution of 0.1 nm is possible by dividing the waveform graph into 2000 segments between the peaks.
Optical interferometers measure changes in height by measuring the changes between light and dark in regular interference stripes.
Phase shift interferometry (PSI)
Determining whether the shape of the target is on an upward slope or downward slope is not possible when using interference stripes generated from a single-wavelength light source. However, this problem can be solved using phase shift interferometry.
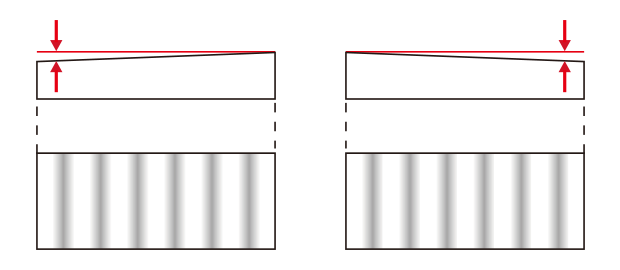
As shown in the figure to the left, the interference pattern from a singlewavelength light source is the same for both upward and downward slopes, making it impossible to determine the direction.
To solve this problem, the height is measured by capturing four interference stripe images as the objective lens and target are moved by λ/8 (1/8 wavelength) of the light source. This measurement method is called phase shift interferometry (PSI).
The main features of phase shift interferometry are as follows:
-
1High-resolution Å (angstrom) order measurements are possible.
-
2The measurement time is short.
Reason for using white light as a light source
Appearance of interference stripes
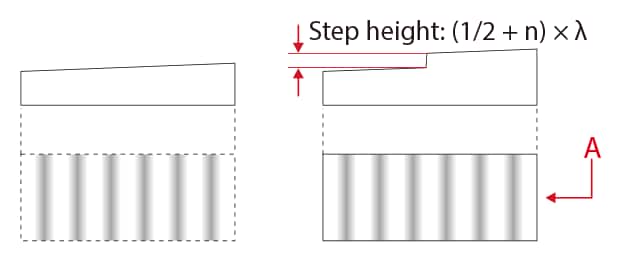
A: The interference stripes are the same even though the heights are different.
Measurement using a single-wavelength light
As shown in the figures to the left, with a height difference of (1/2 + n) × the wavelength λ of the light source, no changes are noticeable in the interference stripes, so determining the correct height difference is not possible.
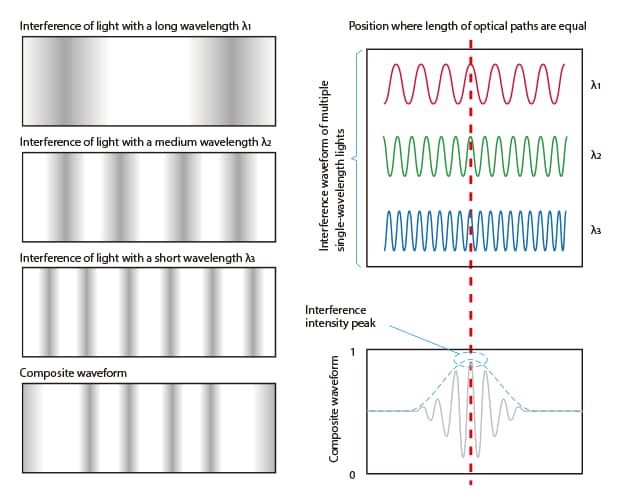
Composite interference stripes
Measurement using white light
When using a white light source, the interference stripes on the measurement surface at the focal point of the objective lens become stronger, and disappear when moving away from the focal point. Using a composite waveform created by superimposing interference stripes of different wavelengths makes it possible to detect the interference intensity peaks.
Measurement of uneven surfaces
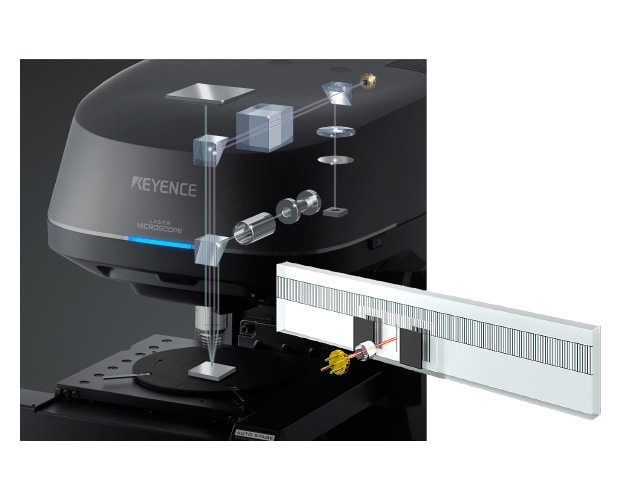
Keyence's 3D Surface Profiler with a built-in white light interferometer uses a white LED to determine the interference stripe intensity at each height interval by moving the objective lens. Height information from the focal point position is obtained by using a linear scale to measure the lens position at the point where the interference stripes become stronger. This method is called vertical scanning interferometry (VSI).
VK-X3000
Linear scale module
Objective lens scanning and interference stripe intensity
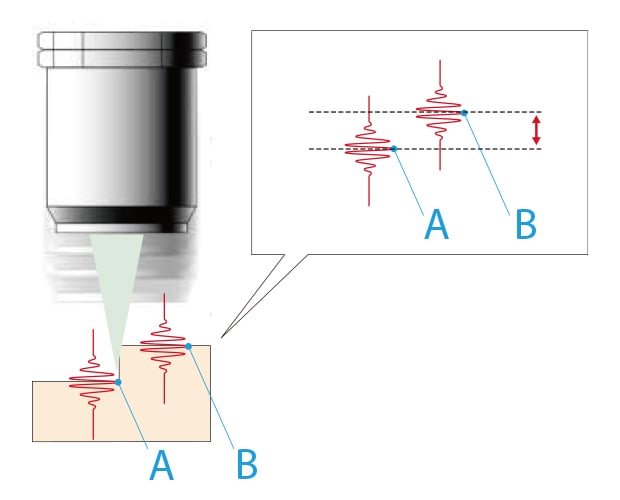
The difference between the interference intensity peaks at points A and B indicates the height difference.
High-accuracy measurement even at low magnifications
Height resolution with an optical interferometer does not depend on the magnification of the objective lens because a composite waveform representing the interference stripe intensity can be accurately reproduced through calculation even if the depth of field of the objective lens is high.
The interference stripes of light appear at regular intervals because the light wavelength is constant. This means that, if the wavelength being used is known in advance, it is possible to calculate what the composite waveform from the interference stripe intensity will look like.
High resolutions can then be achieved by reproducing a composite waveform graph from the interference intensity captured at regular intervals and separating the reproduced composite waveform for processing.
Composite waveform representing interference stripe intensity
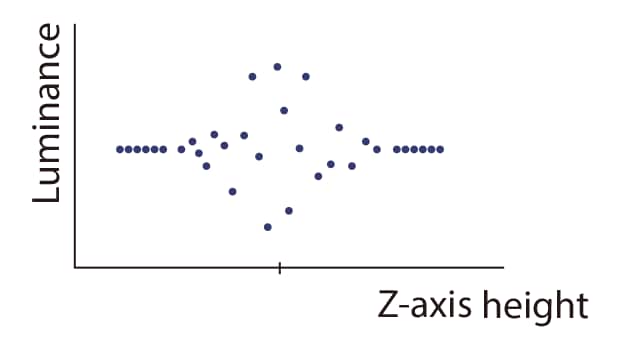
The composite waveform of the interference stripe intensity can be reproduced from the interference fringes captured at regular intervals using an arithmetic formula.
Composite waveform representing interference stripe intensity
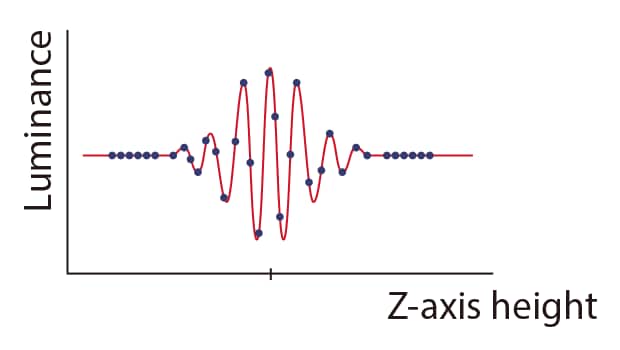
The peak of the created composite waveform is the focal point position of the lens, and height can be determined through synchronization with the travel distance of the lens.
Key points for white light interferometry
Focusing
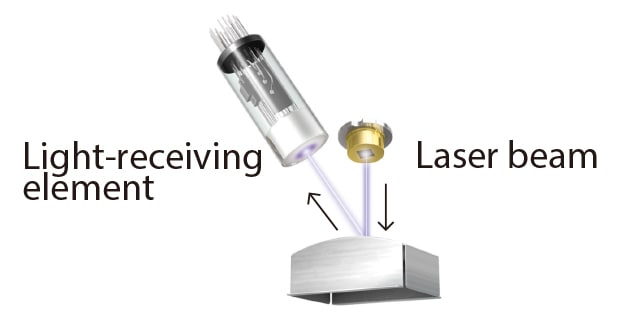
Focusing on the observation screen may be difficult with a white light interferometer because interference signals are weaker for low-reflectivity targets. The VK-X3000 camera is able to focus on low-reflectivity targets with high sensitivity thanks to the included laser auto-focus function.
Zeroing
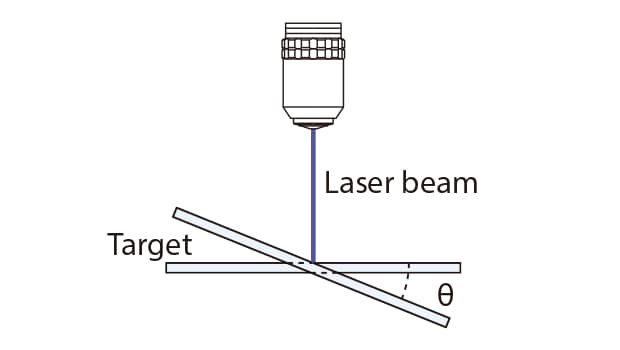
To ensure accurate measurement with a white light interferometer, the target must be leveled, otherwise known as zeroing. With conventional systems, ensuring the target is level required users to check the interference stripes visually and readjust several times. Keyence's 3D Surface Profiler has a built-in zeroing support function to detect any tilting of the target and automatically calculates the correction angle. Being able to determine the correction angle in advance allows for easy, reliable, and fast adjustment.
White Light Interferometers Characteristics
| Advantages | Disadvantages |
|---|---|
|
Advantages
|
Disadvantages
|
3D Surface Profiler overcome limitations of White Light Interferometers
Solutions for low angular characteristics
| Difficulties with interferometers | Solved with Keyence's 3D Surface Profiler |
|---|---|
|
Difficulties with interferometers
When using interferometers to measure objects with steep angles, due to the concentration of interference patters in those areas, accurate information cannot be gathered. |
Solved with Keyence's 3D Surface Profiler
The confocal range finding system, which uses laser reflection intensity for detection, can measure shapes that have high angular characteristics with low noise. |
Observation with interferometer
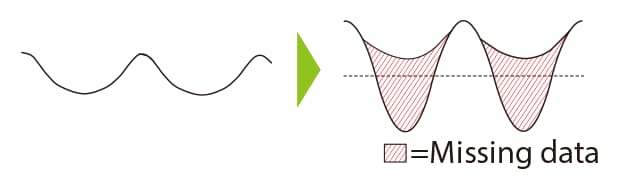
Right: Comparison with correct measurement data
Curved surface cannot be measured due to how electromagnetic waves interfere.
Observation with laser microscope
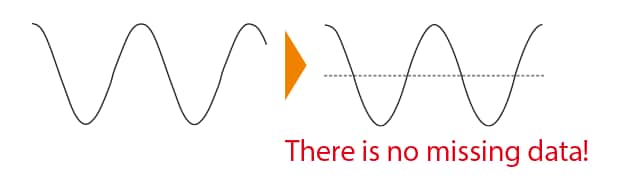
Right: Comparison with correct measurement data
Laser will go into grooves to detect curves.
Solutions for limited measurement targets
| Difficulties with interferometers | Solved with Keyence's 3D Surface Profiler |
|---|---|
|
Difficulties with interferometers
With light interference, if the surface does not reflect well, measurement is difficult to perform, limiting the type of targets that can be measured. Measurement also cannot be performed if there is an extreme difference between the reflected light from the reference surface and the reflected light from the measurement surface. Interferometers work well with mirrored-surfaces, but have difficulty measuring samples with extreme projections and depressions and samples whose surface is not very reflective. |
Solved with Keyence's 3D Surface Profiler
Because laser scanning microscopes use a photomultiplier (PMT) with a wide sensitivity range, targets that include areas of both high and low reflectivity can be measured accurately. |
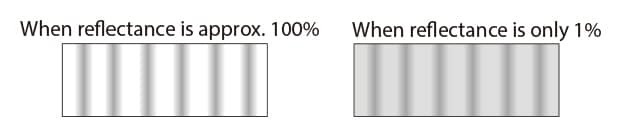
If the reflectance from the reference surface is 100% and the reflectance from the measurement surface is also approximately 100%, clear interference stripes appear.
However, if the reflectance from the measurement surface is only 1%, the contrast is not as defined.
Solutions for problems requiring slope correction
| Difficulties with interferometers | Solved with Keyence's 3D Surface Profiler |
|---|---|
|
Difficulties with interferometers
Before measurement, slope correction of the sample with a goniometer stage is required. |
Solved with Keyence's 3D Surface Profiler
Because Keyence's 3D Surface Profiler is equipped with both white light interferometry and laser confocal scanning, nearly any sample can be measured, including those with steep angles. |
Solutions for low lateral resolution
VK-X3000
| Difficulties with interferometers | Solved with Keyence's 3D Surface Profiler |
|---|---|
|
Difficulties with interferometers
Since interferometers operate on white light, the lateral resolution of these systems will be the same as a conventional optical microscope - approximately 0.43 μm 0.02 Mil. |
Solved with Keyence's 3D Surface Profiler
Keyence's 3D Surface Profiler is also equipped with laser confocal scanning, which can achieve a lateral resolution of 0.13 μm 0.01 Mil. |