3D Optical Profiling Microscope
How Surface Height Is Quantified — From Ra to Rz
Key Takeaways
- Surface roughness height parameters quantify vertical surface variations, providing an objective way to evaluate surface quality and functional performance.
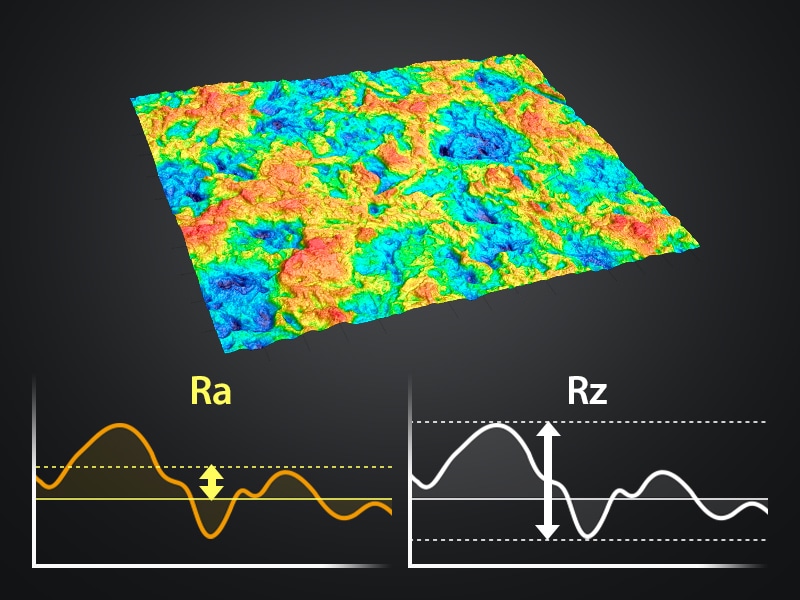
- Ra is widely used for general surface finish control, but it averages height deviations and can mask critical peaks, valleys, and defects.
- Rz and other peak-to-valley parameters reveal surface extremes, making them essential for assessing wear, sealing, lubrication, and fatigue-related risks.
- International standards such as ISO 21920, ISO 25178, and ASME B46.1 ensure consistent, traceable roughness measurement and reporting across manufacturing environments.
In precision manufacturing, a component’s surface finish can make the difference between reliable performance and premature failure. Surface texture affects how parts wear, how they interact with coatings, how fluids flow across them, and even how they bond with adhesives. To control these critical factors, manufacturers rely on surface roughness parameters – such as Ra and Rz - that describe the quality of a surface through quantitative values. Understanding what these values quantify is essential for quality control, product performance, and compliance with industry standards.
This article will focus on five roughness parameters that are used to quantify height changes on a surface. Future articles will cover topics related to spatial/wavelength parameters, hybrid parameters, functional parameters, and 3D area parameters.
What Are Surface Roughness Parameters?
Surface roughness parameters are values calculated across either a single profile or an entire 2D area. They help break down complex surface geometries into standardized metrics that engineers can specify, compare, and track across the varying manufacturing processes and inspection cycles.
Rather than relying on subjective visual inspection, roughness parameters provide an objective way to clearly describe how smooth or textured a surface truly is. These values are derived from height variations relative to a reference plane or mean line and can be extracted from both 2D line profiles and full 3D surface measurements, depending on the measurement technique used.
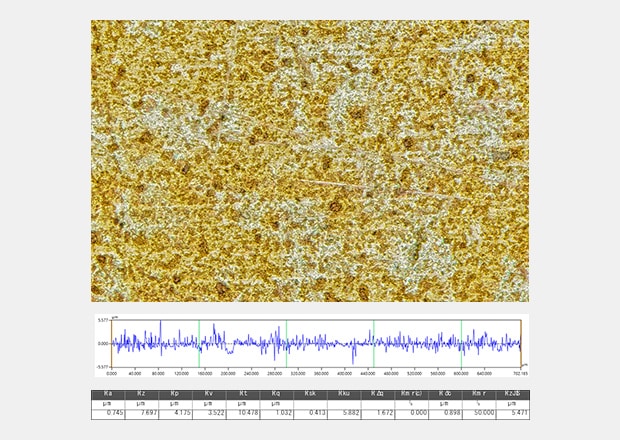
Example roughness measurement on a machined metal surface
Surface roughness parameters play a critical role in product performance and quality control. They influence decisions made based on:
- Friction and wear
- Coating adhesion
- Lubrication retention
- Optical performance
- Sealing behavior
- Fatigue life
As a result, they are widely used in industries such as:
- Precision machining
- Automotive
- Semiconductor manufacturing
- Aerospace
- Additive manufacturing
- Medical device production
To ensure consistency and traceability, surface roughness parameters are defined and standardized in international specifications, including ISO 29120 for profile (2D) parameters, ISO 25178 for areal (3D) surface texture parameters, and ASME B46.1 for surface texture measurement and reporting. These standards define not only the parameters themselves, but also how surfaces should be filtered, measured, and reported to ensure meaningful and repeatable results across different instruments and facilities.
By selecting the appropriate roughness parameters and measurement method, engineers can better link surface texture to functional requirements - turning surface metrology results into simple, tangible next steps to solve root problems both quickly & effectively.

Key Surface Roughness Parameters
Let’s take a look at some of the most common roughness parameters used that you may encounter in your manufacturing operations and break them down.
Ra vs. Rz vs. Sa (Quick Comparison)
Ra is best for quick comparisons,
Rz highlights outliers and surface damage, and
Sa provides a more complete representation of complex or textured surfaces.
| Parameter | Type | What It Represents | When It’s Used |
|---|---|---|---|
|
Parameter
Ra
|
Type
2D profile
|
What It Represents
Average height deviation from the mean line
|
When It’s Used
General surface finish control
|
|
Parameter
Rz
|
Type
2D profile
|
What It Represents
Average peak-to-valley height
|
When It’s Used
Detecting surface extremes
|
|
Parameter
Sa
|
Type
3D areal
|
What It Represents
Average height deviation across a surface area
|
When It’s Used
Functional surface analysis
|
Ra (Roughness Average)
- Definition:
-
Ra is the arithmetic mean of the absolute values of surface height deviations from the mean line over the evaluation length. This is defined by the equation shown below:
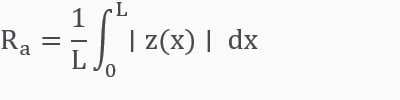
- Where:
-
- L = evaluation length
- z(x) = vertical deviation of the surface profile from the mean line
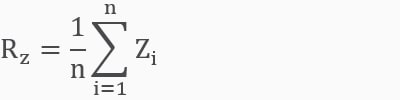
In practice, for discrete measured data points, Ra is calculated as: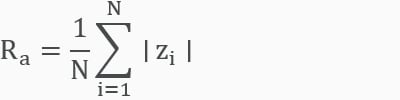
- Where:
-
- N = number of sampled points
- zi = height deviation of each point from the mean line
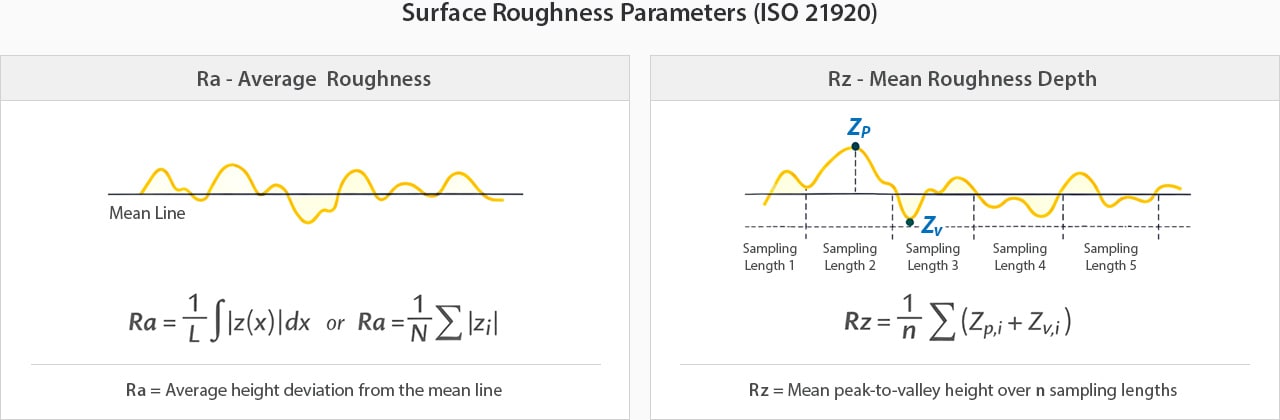
What Does Average Roughness (Ra) Actually Mean?
Average roughness (Ra) describes how much a surface’s height varies, on average, from its mean line. Put simply, Ra answers the question: “How rough is this surface overall?”
Rather than focusing on individual peaks or valleys, Ra averages the absolute height deviations across a defined evaluation length. This makes it easy to compare surfaces and set general finish requirements without analyzing every microscopic feature.
Because of its simplicity and long history, Ra is the most commonly specified surface roughness parameter on engineering drawings and inspection reports. It is widely used for:
- General machining quality checks
- Incoming inspection and supplier qualification
- Trend monitoring in production environments
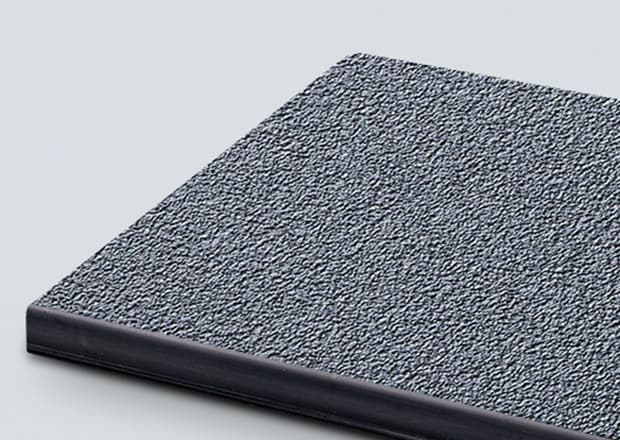
However, Ra does not describe surface shape or extremes. Two surfaces can have the same Ra value while exhibiting very different textures, such as one dominated by sharp peaks and another by deep valleys.
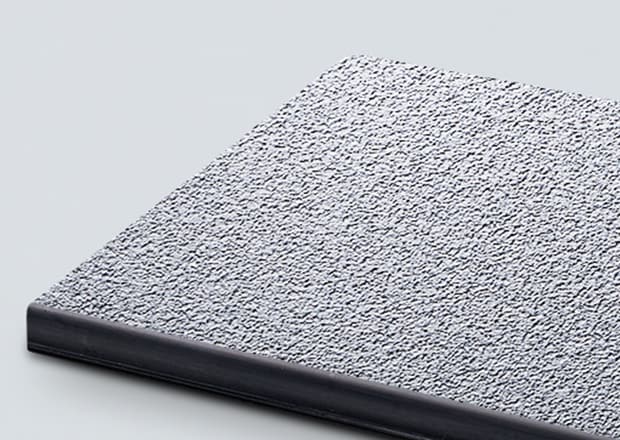
Two surfaces that are visually different but have the same Ra. What other roughness parameters can determine how they vary?
When Ra Alone Is Not Enough
While Ra is useful, it can be misleading for functional surfaces. It does not account for:
- Peak sharpness or valley depth
- Surface directionality or lay
- Local defects such as scratches or pits
For applications involving sealing, lubrication retention, wear performance, or optical quality, engineers often supplement Ra with additional parameters such as Rz, Rq, Rp, or 3D areal parameters defined in ISO 25178.
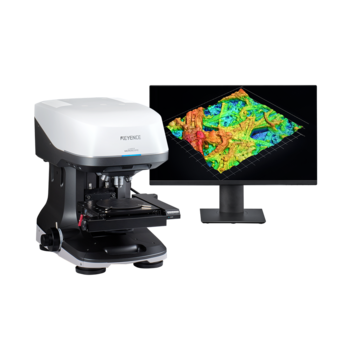
Modern non-contact optical profilometers and 3D surface measurement systems (such as the VK-X4000 Series) make it possible to capture full 3D surface topography, enabling engineers to move beyond a single roughness number and correlate surface texture with real-world performance quickly & accurately.
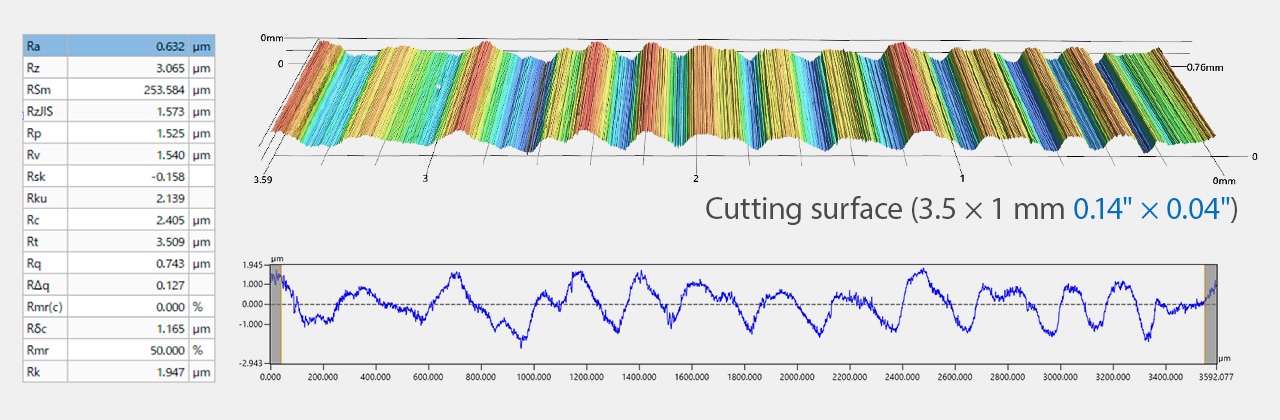
Surface Roughness Measurement Examples
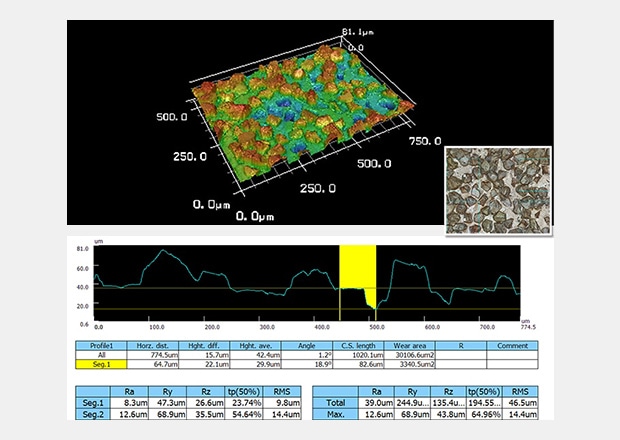
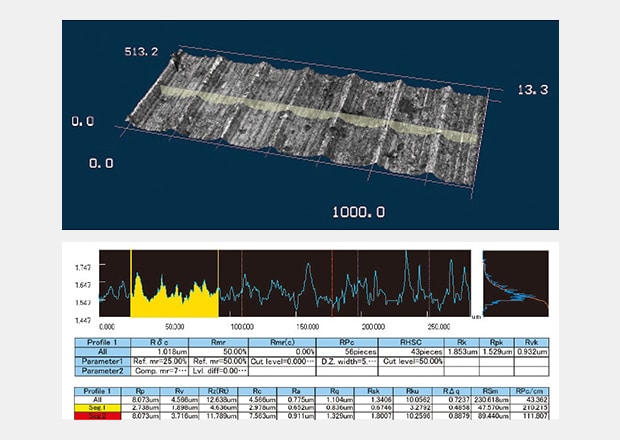
Grindstone surface
The VK-X4000 Series 3D Optical Profiling Microscope can measure both line and area roughness on virtually any material or surface shape. By integrating three distinct measurement methods, it allows users to select the approach that best fits their application, whether the goal is achieving maximum resolution or quickly scanning larger areas.
Get detailed information on our products by downloading our catalog.
View Catalog

Rz (Mean Peak-to-Valley Height)
Rz is a surface roughness parameter that describes the average peak-to-valley height of a surface profile. Unlike Ra, which averages all height deviations, Rz emphasizes the vertical extremes of the surface and is therefore more sensitive to scratches, tool marks, and surface damage.
Rz is especially useful when surface performance is influenced by maximum heights or depths, such as sealing surfaces, wear interfaces, and parts where excessive peaks could cause premature failure.
The exact definition of Rz depends on the standard used, which is an important distinction in engineering practice.
Rz (ISO 21920)
- Definition:
-
Under ISO 21920-2, Rz is defined as the mean height of profile elements, calculated from individual sampling lengths within the evaluation length.
-
Where each profile element height Zi is:
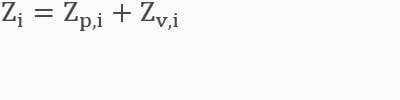
- Where:
-
- n = number of sampling lengths within the evaluation length
- Zp,i = height of the highest profile peak within sampling length i
- Zv,i = depth of the deepest profile valley within sampling length i
- All heights are measured relative to the mean line of each sampling length
- Where:
-
- Zp,i = height of the highest peak in the i-th sampling length
- Zv,i = depth of the deepest valley in the i-th sampling length
ASME (ASME B46.1 – Rz / Rz (DIN))
- Definition:
-
In ASME B46.1, Rz is often defined as the average difference between the five highest peaks and five deepest valleys over the evaluation length:
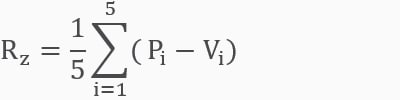
- Where:
-
- Pi = height of the i-th highest peak
- Vi = depth of the i-th deepest valley
What Does Rz Actually Tell You?
In practical terms, Rz answers the question: “How tall are the peaks and how deep are the valleys?”
Rz can be more sensitive to noise or isolated defects than Ra and should be interpreted alongside other parameters. Because it focuses on surface extremes, Rz is well suited for:
- Detecting scratches, dents, and machining marks
- Evaluating sealing and contact surfaces
- Monitoring tool wear and process instability
When to Use Rz
Rz is commonly specified when:
- Excessive peaks may cause wear or sealing failure
- Valley depth affects lubrication or coating behavior
- Surface defects must be tightly controlled
For complex or functional surfaces, engineers increasingly supplement Rz with 3D areal parameters (Sz, Sa, Sq) obtained from optical surface metrology systems. We’ll cover those in more detail in a future article.
Rz vs. Ra (Quick Comparison)
In many applications, Ra and Rz are specified together to provide both an overall surface quality metric and insight into worst-case surface features.
| Parameter | Focus | Strength | Limitation |
|---|---|---|---|
|
Parameter
Ra
|
Focus
Average deviation
|
Strength
Stable, easy to compare
|
Limitation
Masks surface extremes
|
|
Parameter
Rz
|
Focus
Peak-to-valley height
|
Strength
Highlights damage and defects
|
Limitation
Sensitive to outliers
|
*L = Evaluation Length
**n = Number of Sampling Lengths

Other Common Parameters
Here are some additional parameters that relate specifically to height differences when measuring surface roughness. We won’t go into as much detail on each of these as we did for Ra and Rz, but this information should be sufficient to give you a basic understanding of what these roughness parameters define and how they are used.
Rq / RMS (Root Mean Square)
- Definition:
-
Rq (or RMS roughness) is the square root of the mean of the squared height deviations.
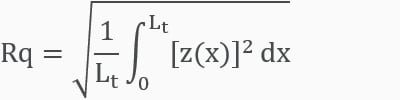
- Where:
-
- Rq = root mean square roughness (µm)
- Lt = evaluation length (after filtering, ISO 21920 defines cut-offs and profile separation)
- z(x) = height deviation from the mean line at position x
- Interpretation:
- Because it squares the deviations, Rq gives more weight to larger peaks and valleys than Ra. It’s particularly useful when extreme variations are important.
- Use Cases:
-
- Optical components and semiconductor wafers.
- Coating adhesion studies.
- Fatigue analysis where micro-defects can act as stress concentrators.
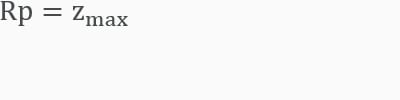
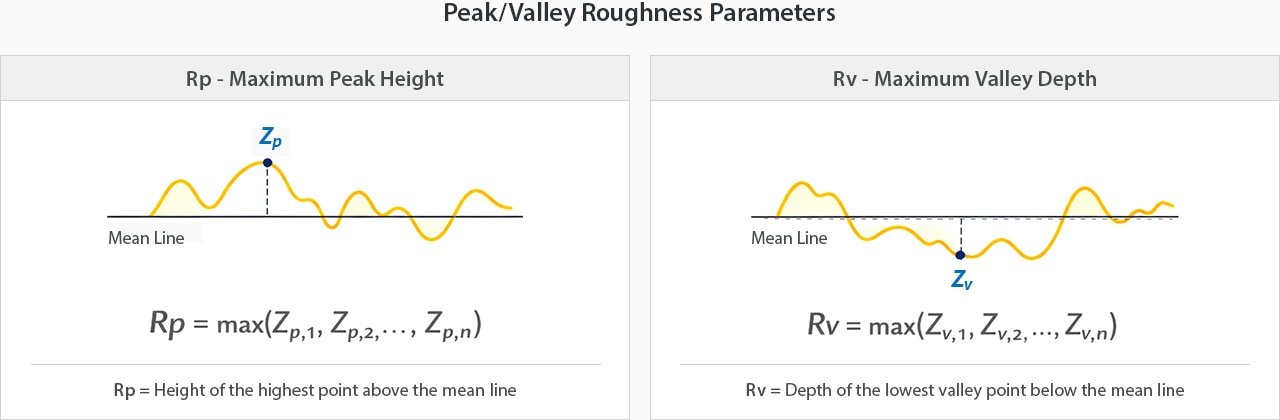
Rp / Rv (Max Peak / Max Valley Height)
- Definition:
-
Rp measures the distance from the mean line to the highest peak within the evaluation length.
- Interpretation:
- Rp emphasizes surface protrusions, which are critical in cases where peaks can cause premature wear or affect coating thickness uniformity.
- Use Cases:
-
- Coating adhesion and paint coverage control.
- Contact-sensitive surfaces (optical mounts, lenses).
- Wear-resistant component design.
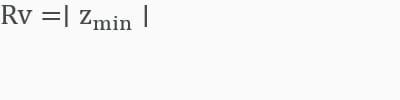
Rv – Maximum Profile Valley Depth
- Definition:
-
Rv is the distance from the mean line to the deepest valley in the evaluation length.
- Interpretation:
- Rv indicates the depth of surface depressions and is especially relevant for lubrication retention, fatigue initiation, and sealing performance.
- Use Cases:
-
- Oil-retaining surfaces (engine components, bearings).
- Analyzing defects caused by pitting or corrosion.
- Evaluating post-polish surface integrity.
*n = Number of Sampling Lengths
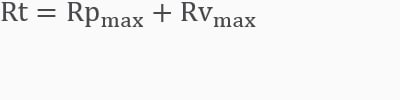
Rt (Total Height of Profile)
- Definition:
-
Rt is the vertical distance between the highest peak and lowest valley over the entire evaluation length.
- Interpretation:
- Rt reflects the most extreme surface feature combination which is useful for identifying defects, scratches, or tool marks that exceed tolerance limits.
- Use Cases:
-
- Outlier detection in precision machining.
- High-spec inspection for aerospace and optical components.
- Ensuring no catastrophic peaks or valleys compromise sealing or wear.
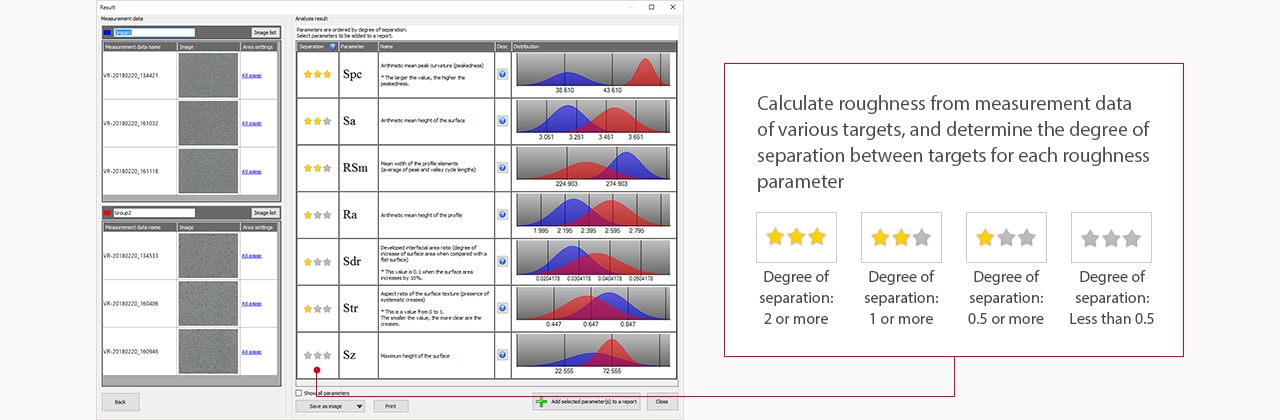
The VK-X4000 Series 3D Optical Profiling Microscope features an advanced software function that automatically analyzes data from two or more surfaces and identifies which roughness parameters show the greatest differences between them. In addition, comprehensive data can be output for dozens of parameters, ensuring you have the detailed insight needed to make confident, informed decisions without needing to be an expert on roughness measurements.
Surface Height Measurement: Ra, Rz and What Comes Next
Understanding and measuring surface roughness parameters is essential for quality control in modern manufacturing. While Ra and Rz are the most commonly specified, additional parameters provide deeper insights into surface texture and performance. We’ll cover other roughness parameters in future articles, so be on the lookout.
With advanced optical profilometers, these measurements can be captured quickly, accurately, and non-destructively to help companies stay competitive in industries where precision is everything.
Explore our surface roughness measurement solutions to see how optical profilometry can streamline your inspection process.
![Introduction to Surface Roughness [ISO 25178]](/img/asset/AS_94988_L.jpg)