3D Optical Profiling Microscope
Spatial Roughness Parameters: Understanding RSm, Spacing, and Surface Feature Frequency
Key Takeaways
- Spatial roughness parameters describe lateral feature spacing and reveal surface behavior that height parameters alone cannot.
- RSm and Pc capture feature spacing and density, strongly influencing sealing, lubrication, friction, and wear.
- Wavelength parameters (λa and λq) help identify machining dynamics such as vibration and chatter.
- Surfaces with the same Ra can perform very differently due to differences in spatial texture.
- Combining spatial and height parameters leads to more reliable surface specifications and performance predictions.
Controlling surface roughness requires more than quantifying height alone. Surface texture also varies laterally in the spacing, frequency, and patterning of peaks and valleys. These horizontal characteristics strongly influence how surfaces behave under motion, load, temperature, and fluid contact.
Spatial roughness parameters help reveal how often surface features occur and how they are distributed. When interpreted alongside height parameters such as Ra or Rz, spacing parameters help engineers understand key performance behaviors such as lubrication retention, friction and wear, sealing effectiveness, fatigue initiation, and optical scatter.
This article focuses on spatial roughness parameters that quantify spacing in a 2D line profile. Future articles in this series will cover hybrid parameters, 3D spatial parameters, and functional performance indicators such as bearing ratio.
What Are Surface Spatial Parameters?
Surface spatial parameters describe the horizontal arrangement of texture elements, such as spacing, repeat frequency, directional lay, and wavelength content. They offer a standardized way to analyze lateral texture features generated by machining, polishing, blasting, additive manufacturing, and tool wear processes.
Rather than measuring the height of peaks and valleys, spatial parameters capture:
- Average spacing between profile elements
- Number of peaks per unit length
- Dominant wavelength of the surface texture
- Structure and regularity of directional lay
- Texture scale relationships
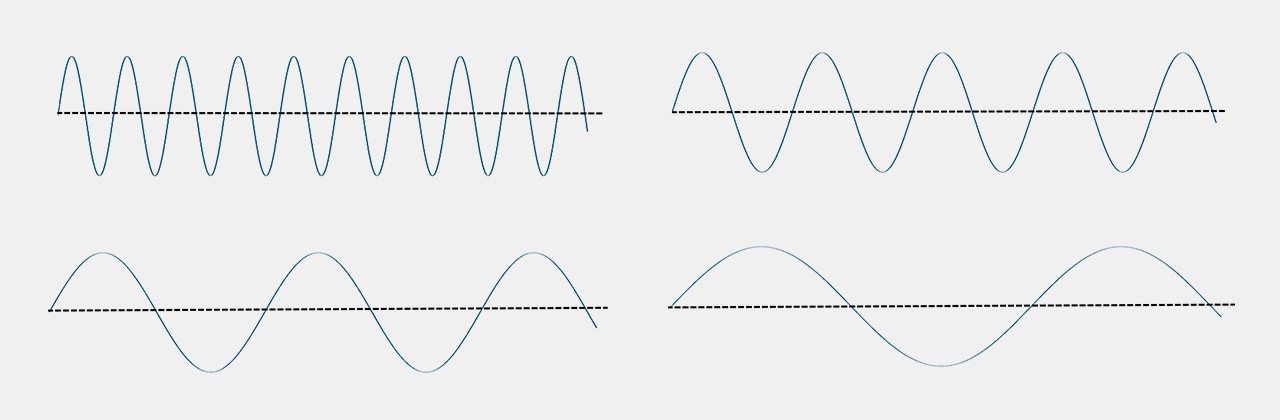
Looking at the wavelengths below, the Ra values are all the same even though the waveforms are clearly different. We must evaluate spatial parameters to understand how these vary.
Like height-based values, 2D spatial parameters are defined and formalized under international standards to ensure consistency, traceability, and comparability across measurement systems:
- ISO 21920 for linear profile parameters
- ASME B46.1 for surface texture specification and reporting

Key Spatial Roughness Parameters
This section gives an overview of spatial roughness parameters—RSm, Pc, and the wavelength metrics λa/λq—and explains how the spacing, peak density, and dominant wavelengths of surface features control sealing performance, lubrication retention, friction, and wear. Together these metrics reveal functional behavior and process health that Ra alone cannot capture, helping engineers diagnose leakage risks, bearing/lubrication performance, and machining stability.
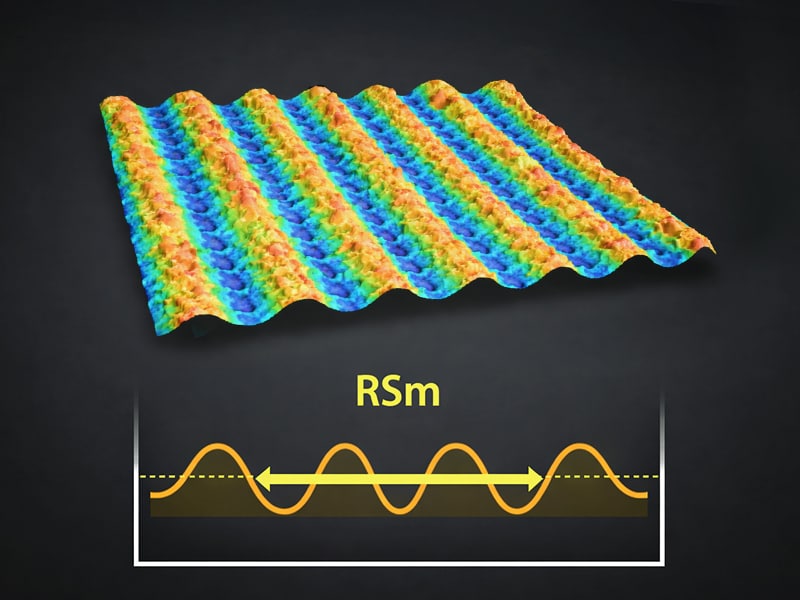
RSm — Mean Spacing of Profile Irregularities
RSm describes the mean distance between consecutive profile features that cross the mean line.
Mathematically:
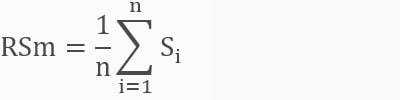
Where:
- Si = horizontal spacing between irregularity boundaries
- n = number of spacing intervals in the evaluation length
What It Means in Practice
RSm answers the question:
“How frequently do peaks and valleys occur along the surface?”
While roughness parameters like Ra describe how tall surface features are, RSm describes how far apart those features are. That spacing turns out to be just as important—if not more so—when it comes to preventing leaks.
Surfaces with small RSm values have tightly packed features, which may improve sealing and lubrication performance. Larger spacing suggests smoother flowing surfaces with reduced friction and lower wear rates.
For a seal to work, two things have to happen at the interface. First, the surfaces need to conform to each other under load. Second, they must block any continuous paths that would allow gas or fluid to flow across the interface. RSm directly influences this second requirement by controlling the lateral width of the channels that can form between surface features.
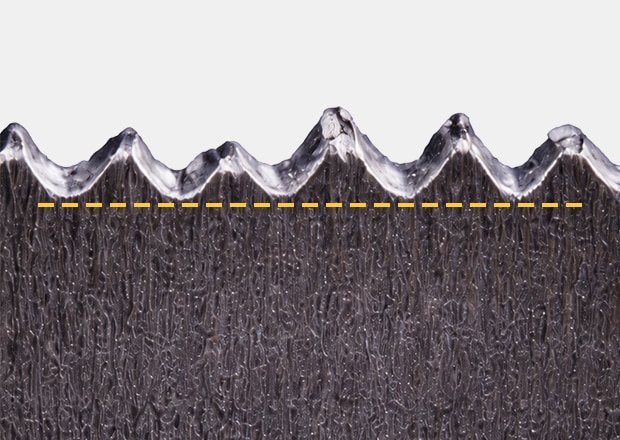
Low RSm = 50 µm
When RSm is low, surface features are closely spaced. This means there are many peaks and valleys packed into a short distance, creating narrow grooves and short flow paths. Under compression, these closely spaced asperities deform or collapse more easily, allowing the surfaces to make contact across a larger area. Any remaining gaps tend to be narrow and discontinuous, which makes it difficult for air or fluid to pass through. As a result, surfaces with low RSm generally seal more effectively, especially in applications involving elastomer seals, gaskets, or metal-to-metal contact under sufficient load.
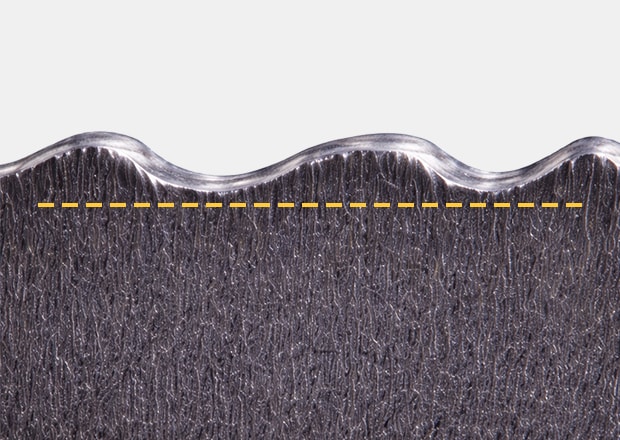
High RSm = 400 µm
In contrast, a high RSm surface has features that are spaced farther apart. There are fewer peaks per unit length, and the valleys between them are wider and longer. These wide valleys can act as continuous leakage channels, allowing air or gas to bypass the contact points between peaks. Closing these gaps often requires much higher clamping forces, and even then, leakage can persist. This is why surfaces with high RSm are more prone to sealing failures, particularly in gas or vacuum applications, even if the surface appears smooth based on Ra alone.
This highlights an important limitation of relying solely on Ra for sealing specifications. Two surfaces can have the same average roughness yet behave very differently. A surface with low Ra but high RSm may look smooth, but its wide grooves can form effective leak paths. Meanwhile, a surface with a slightly higher Ra but low RSm may seal better because its closely spaced features disrupt flow paths more effectively. This mismatch is a common reason seals fail when Ra is the only parameter specified.
It’s also important to consider directionality, as strongly directional surface textures can create straight-through leakage paths even if RSm is low in one direction. For best results, RSm should be evaluated alongside other functional parameters such as Rpk and Rvk for bearing and valley behavior, skewness (Rsk) to understand peak dominance, and areal parameters like Sal and Str to capture surface texture direction and isotropy.
Use Cases
- Predicting lubrication retention
- Evaluating cutting and grinding tool behavior
- Diagnosing machining vibrations
- Assessing surface fatigue behavior
Industry Example
Grinding wheel wear causes spacing between cutting points to expand progressively. Even if Ra remains constant, a shifting RSm value may indicate loss of surface uniformity, leading to higher friction and greater risk of surface burn.

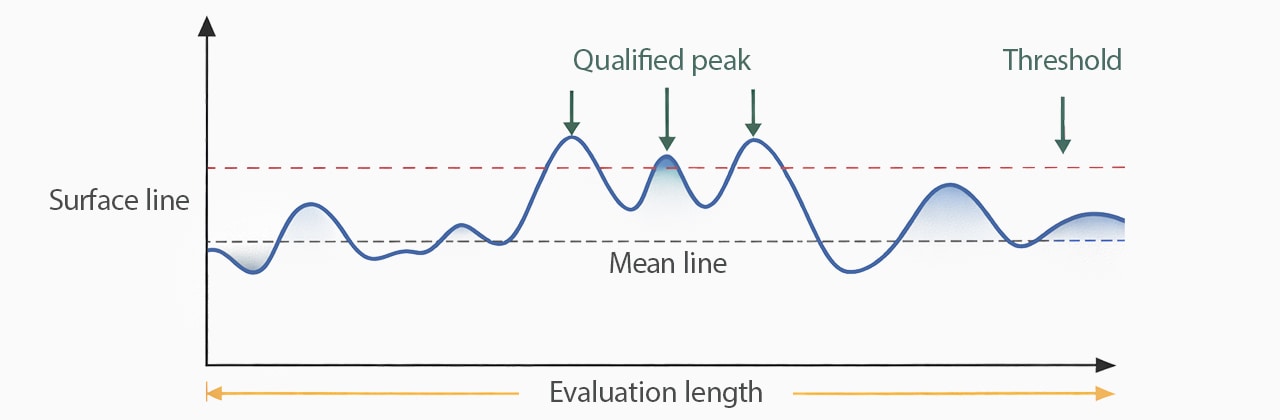
Pc — Peak Count per Unit Length (ISO)
Peak count reflects how many surface peaks exceed a filter threshold per evaluation length:
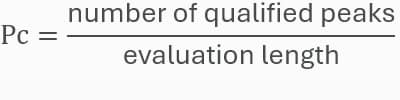
Pc describes texture density: a high peak count indicates fine grain surfaces, while a low count suggests broader surface structure.
Peak Count per Unit Length
Common Applications
- Wear interface design
- Roller bearing lubrication analysis
- Consistency checks in precision grinding
Industry Example
In optical polishing, an increase in peak density typically signals successful texturing control. In contrast, low peak count may produce glare, scatter, or haze. Even if Ra is identical, the number of peaks affects optical behavior significantly.
λa (Average Wavelength) and λq (Root Mean Square Wavelength)
These two parameters describe the dominant wavelength of the surface — similar to analyzing vibration signals.
λa (Arithmetic Mean Wavelength)
Represents the average wavelength of surface waviness or roughness features along the profile.
λq (RMS Wavelength)
Gives more weight to large wavelength features than λa.
Why They Matter
Wavelength parameters are especially sensitive to machining dynamics, and they are excellent indicators of process health and stability.
- Cutting tool vibration
- Chatter frequency
- Machine tool harmonics
Industry Example
In precision turning, excessive λq wavelength often reveals tool chatter caused by instability in feed rate or cutting forces. Engineers may use wavelength analysis to correlate machine vibration events with surface texture patterns to prevent premature tool failure.
Key Differences Between Spatial Parameters
| Parameter | Measurement Type | Domain | Output | Sensitivity |
|---|---|---|---|---|
|
Parameter
λa
|
Measurement Type
Average spacing
|
Domain
Frequency / statistical
|
Output
Length
|
Sensitivity
Low
|
|
Parameter
λq
|
Measurement Type
RMS spacing
|
Domain
Frequency / statistical
|
Output
Length
|
Sensitivity
High
|
|
Parameter
RSm
|
Measurement Type
Mean element spacing
|
Domain
Time / feature-based
|
Output
Length
|
Sensitivity
Medium-high
|
|
Parameter
Pc
|
Measurement Type
Peak density
|
Domain
Count-based
|
Output
Peaks / length
|
Sensitivity
Very high
|
How They Relate
- λa vs RSm:
Both describe spacing, but λa is statistical/spectral, while RSm depends on explicit peak and valley identification. - λq vs λa:
λq highlights irregular spacing that λa averages out. - Pc vs spacing parameters:
Pc is roughly the inverse of spacing, but it lacks information about spacing consistency.
“Higher Pc ⇒ smaller spacing”
The VK-X4000 Series 3D Optical Profiling Microscope analyzes over 40 roughness parameters to provide users with a comprehensive data set for understanding a surface. Our software can also automatically compare multiple surfaces and extract the key quantitative differences between them so that you don’t have to spend your time staring at data to accurately determine the next best step.
Get detailed information on our products by downloading our catalog.
View Catalog

How Spatial Roughness Parameters Are Used in Industry
Spatial parameters are widely used in industries that depend on dynamic surface performance, including:
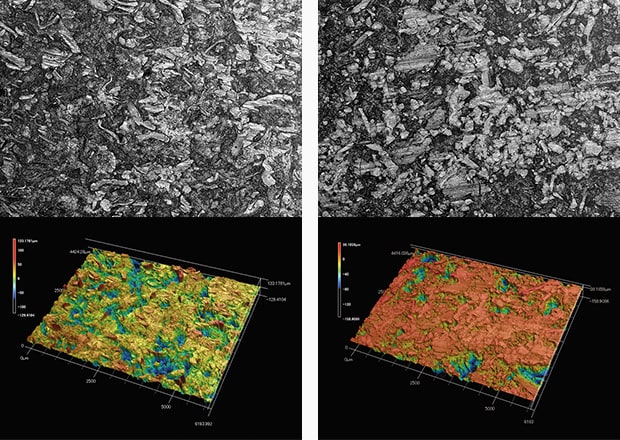
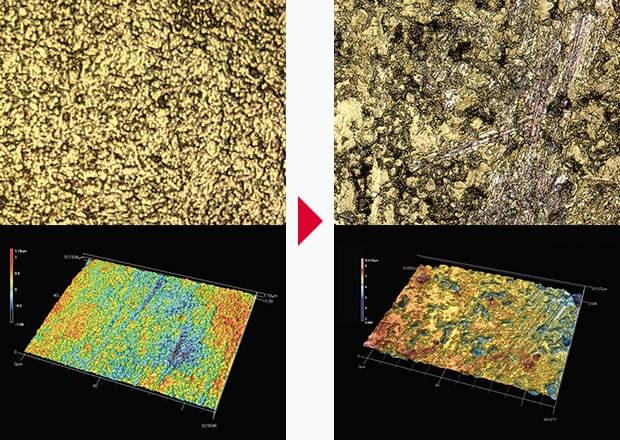
Left: new brake pad / right: worn brake pad
Automotive and Powertrain
Controlling RSm spacing enables predictable oil film retention on pistons, crankshafts, and bearing races. This reduces friction, prevents scuffing, and stabilizes thermal expansion.
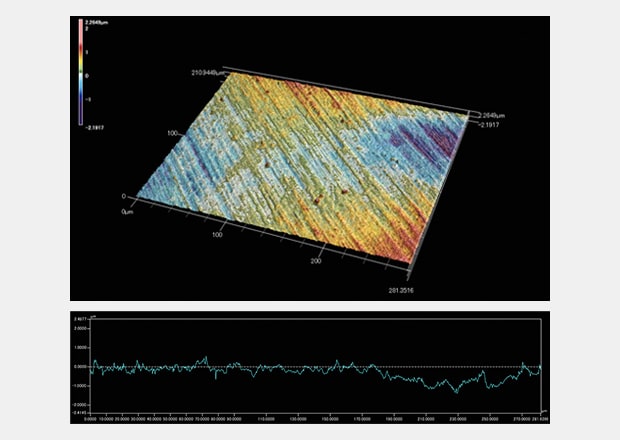
Before and after of plated surface
Medical Device Manufacturing
Orthopedic implant stems and joint components require specific spacing profiles to influence bone ongrowth, wear debris generation, and fluid transport. Identical Ra values between implants may mask significant spatial differences in performance.
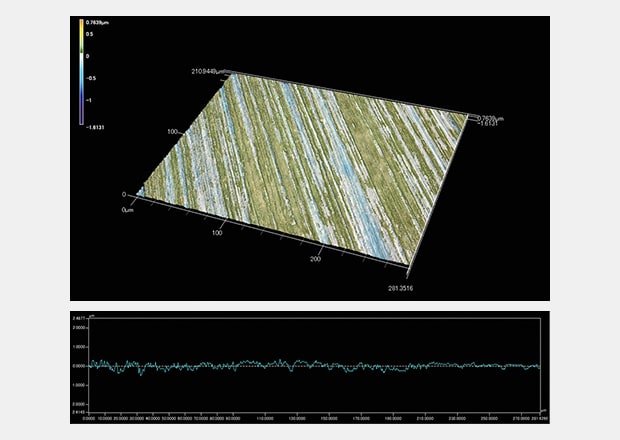
Surface profile before polishing
Semiconductor and Optics
Wavelength parameters such as λa and λq help evaluate optical scatter behavior, wafer polishing stability, and CMP-induced pattern variations.
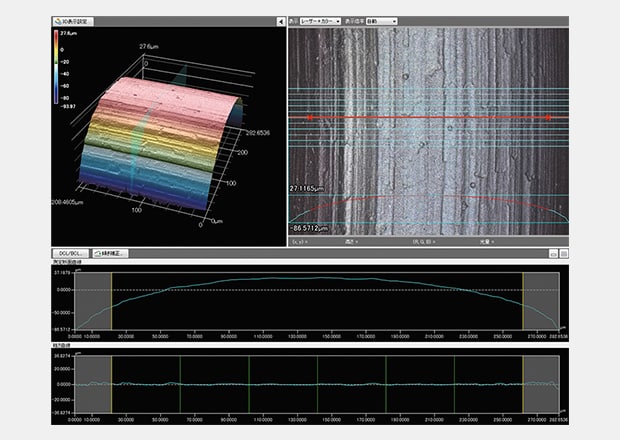
O-ring surface roughness
Aerospace Turbine Sealing
Ring seals, shrouds, and blade surfaces rely on micro-texture spacing to control air leakage, reduce wear, and maintain long-term mechanical efficiency.
Additive Manufacturing
Spatial roughness trends reveal melt pool pattern shifts, porosity distribution, and post-processing tool stability — especially during grinding and polishing steps.
In every case, spatial parameters provide context that height metrics alone cannot.
The VK-X4000 Series 3D Optical Profiling Microscope is ideal for any industry or application. With three different measurement techniques, users can accurately measure the surface of any type of material, regardless of the shape, from millimeters to nanometers. Request an onsite or virtual demo to see how this system can work for you.

Conclusion — Spatial Parameters and What Comes Next
Understanding and measuring spatial roughness parameters is essential for characterizing how surfaces behave under real-world operating conditions. Combined with height parameters such as Ra and Rz, spacing metrics like RSm, Rn, λa, and λq provide a clearer, more complete view of surface functionality and manufacturing consistency.
These measurements help engineers diagnose machining stability, predict lubrication retention, improve sealing performance, control friction and wear, and reduce costly trial-and-error cycles. In industries where precision is everything, spatial roughness parameters unlock insights that height-based values alone cannot.
Future articles in this series will focus on hybrid parameters, functional values, 3D areal spatial metrics, and the evolving ISO 21920 surface texture framework.
![Introduction to Surface Roughness [ISO 25178]](/img/asset/AS_94988_L.jpg)