Fluorescence Microscopes
What is fibrosis?
Fibrosis is a phenomenon in which connective tissue proliferates at an abnormal rate and replaces healthy normal tissue. Excluding the brain, fibrosis occurs in the majority of organs in the body, such as the heart, lung, liver, kidneys, and pancreas, ultimately resulting in their dysfunction.
Specifically, cardiac fibrosis can lead to dilated cardiomyopathy, arrhythmia, and sudden death. Fibrosis in the lungs can cause interstitial pneumonia, in which the stroma of the lungs become thick and hard, causing the lungs to shrink and making it difficult to bring in oxygen. This can lead to shortness of breath, even when a patient is in a resting state. Fibrosis in the liver can lead to cirrhosis.
Fibroblastic cells that cause fibrosis exist in large numbers within cancer-induced stromal tissue. As such, the relationship between fibrosis and cancer is begin researched. After an organ undergoes fibrosis, it is difficult to return back to its previous state, making early detection and suppression of fibrosis very important. To evaluate the progression of fibrosis, methods have been developed that use various markers, such as collagen, platelet counts, and sugar chain biomarkers. Furthermore, there are few therapeutic drugs that are effective against fibrosis, so regenerative medicine research is crucial in potentially reversing the effects of its progression.
Get detailed information on our products by downloading our catalog.
View Catalog

Mechanism of fibrosis
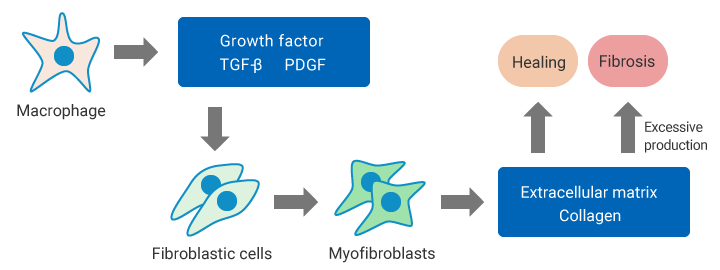
In normal tissue, if an inflammatory response occurs due to tissue damage, an immune response attributable to macrophages occurs together with the secretion of inflammatory cytokines such as TGF-β. The inflammatory cytokines promote the proliferation of fibroblastic cells and the specialization of these cells into myofibroblasts. Myofibroblasts produce the collagen that composes the extracellular matrix. The supplying of a sufficient amount of this collagen as the material for repairs leads to the healing of the inflamed site.
If chronic inflammation occurs, the collagen produced by the myofibroblasts is not absorbed and forms deposits due to an excessive damage repair response. These deposits lead to the progression of fibrosis, eventually resulting in the organ becoming dysfunctional.

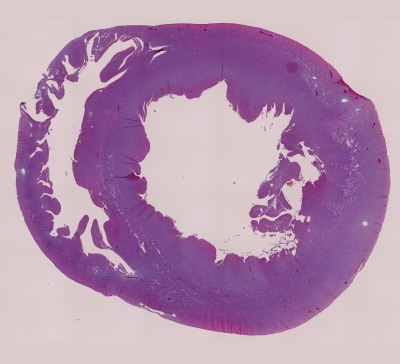
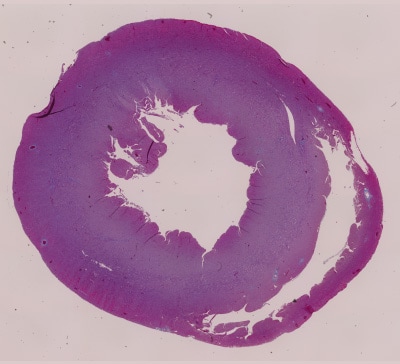
Example of measuring the fibrosis ratio
Area (total):85057246 µm2
Area (fibrosis):2177277 µm2
Area percentage:2.56%
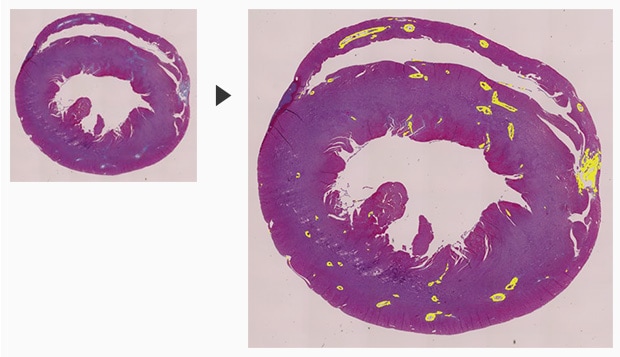
In the following example, KEYENCE’s All-in-One Fluorescence Microscope BZ-X is used to observe a heart and measure its fibrosis ratio.
When analyzing a fibrotic area, a low magnification image results in poor resolution, which makes measuring the fibrotic ratio inaccurate. On the other hand, by using a high magnification objective, only a small portion of the sample can be viewed, which leads to variations and inconsistencies in the measurement results.
With the BZ-X, highly-accurate and stable results can be obtained by capturing multiple images across the specimen at high-magnification and stitching them into a single, seamless image. An automated quantification software can then be used to easily measure the percentage of fibrotic tissue relative to the overall tissue area.
Objective lens: CFI60 CFI Plan Apo λ 4x
Image stitching: 3 images × 4 images
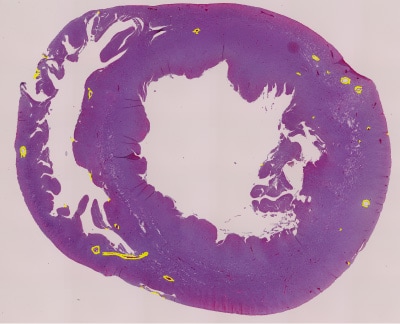
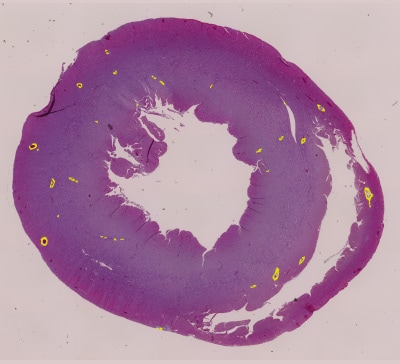
Furthermore, the conditions used in measuring the fibrosis ratio can be saved and applied to other specimens as a batch.
Differences in fibrosis ratios between multiple tissues can be evaluated easily and with high reproducibility.

Batch measurement under the same conditions
Area (total):57210137 µm2
Area (necrosis):413032 µm2
Area percentage:0.72%
Area (total):75525597 µm2
Area (necrosis):381812 µm2
Area percentage:0.51%
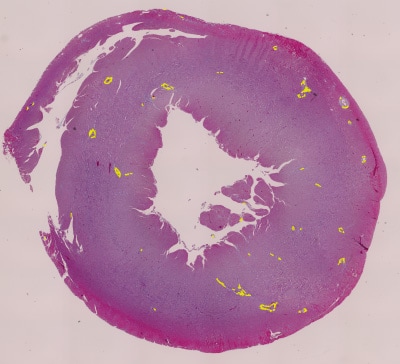
Area (total):77399084 µm2
Area (necrosis):450871 µm2
Area percentage:0.58%
Using the All-in-One Fluorescence Microscope BZ-X
- When a slice of the target is too large to fall within a single field of view, images are captured while moving the stage and a high-resolution image can be created by stitching these images.
- Even for tilted or uneven specimens, it is possible to create an image in which the entire specimen is in focus. This is accomplished by capturing multiple images in the Z-axis and combining only the parts of the image that are in focus.
- Hybrid Cell Count software can extract only fibrotic areas from the entire section and calculate the proportion automatically.
- Based on the conditions set when measuring an individual image, the Macro Cell Count software can apply those conditions across multiple images for rapid, repeatable measurement results.