5 Surface Measurement Bottlenecks That Are Slowing Down Your R&D
Every R&D team has a version of the same problem. Samples sit waiting for instrument time. Results come back incomplete because the measurement captured the wrong area, the wrong feature, or the wrong parameter. The development decision gets delayed, or worse, gets made on data that wasn't adequate to support it. The cycle repeats.
Surface measurement is rarely identified as the primary constraint in a development program, but it often is. CMMs, optical comparators, handheld roughness gauges, and stylus profilometers each have well-established roles in manufacturing and quality control. But those roles were defined around stable, repeated inspection of known part geometries and not around the pace, sample diversity, and iterative demands of modern R&D. When conventional measurement tools are applied to development workflows they were not designed for, they create predictable bottlenecks. Here are the five most common ones.
Key Takeaways
- Conventional surface measurement tools were designed for manufacturing inspection, not for the iterative, high-variability demands of R&D workflows.
- Limited surface coverage from stylus profilometers and handheld gauges makes localized defects and texture variation statistically likely to be missed.
- Long setup and acquisition times on CMMs and stylus systems create throughput constraints that compound across high-sample-count sessions.
- Contact-based instruments including stylus profilometers, CMMs, and handheld gauges restrict which materials can be measured without risk of surface damage or deformation.
- Instruments that report a single number or a single profile, such as handheld roughness gauges and optical comparators, provide insufficient data for functional surface characterization in R&D contexts.
- 3D optical profilometry addresses all five bottlenecks through full-field, non-contact areal measurement that captures complete surface data in a single acquisition.
Bottleneck 1: Measurement Coverage That Leaves Most of the Surface Uncharacterized
The most fundamental limitation shared by several conventional instruments is that they characterize a fraction of the surface while leaving the rest unmeasured.
A handheld roughness gauge drags a probe across a short evaluation length, typically 4 to 5 mm, and returns a single Ra value for that one path. A stylus profilometer extends this to a longer trace but still covers a single line across the surface. On a 10 mm x 10 mm sample, a single stylus trace covers approximately 0.05% of the total area. Optical comparators project a magnified silhouette of the part's edge profile, which is useful for dimensional conformance on simple geometries but captures nothing about the internal surface texture or three-dimensional topography.
In manufacturing QC, where the surface is well-understood and the measurement is confirming a known characteristic at a known location, this level of sampling is often sufficient. In R&D, where the surface behavior is what is being investigated, it frequently is not.
Localized defects, coating thickness variation, processing anomalies, and texture non-uniformity are exactly the features that drive R&D decisions. They are also exactly the features most likely to fall outside a narrow measurement path. A roughness gauge or a stylus trace that misses a critical feature does not report the miss as it has no way to characterize the features beyond that singular point or line.
Bottleneck 2: Setup and Acquisition Time That Doesn't Scale With Sample Volume
Different instruments create throughput problems in different ways, but the result is the same: measurement becomes the rate-limiting step in the development cycle.
CMMs are among the most capable dimensional measurement instruments available, but they are not designed for rapid surface characterization across high sample counts. Fixturing a part, writing or loading a measurement program, executing a multi-point probe routine, and extracting results is a process that can take tens of minutes per part. For development programs iterating across material variants, process conditions, or design geometries, that per-sample time makes CMM-based surface characterization impractical as a routine characterization tool.
Stylus profilometers are faster per trace but slow when building a 3D surface map through multiple parallel traces. Handheld gauges are quick for a single reading but provide little data per measurement and building the statistical confidence needed today means taking multiple readings across multiple locations, which adds time back in a different way.
When measurement throughput cannot keep pace with sample generation, teams respond predictably: they measure fewer samples than they should, reduce the number of locations characterized per sample, or defer measurement until later in the development process. Each response increases the risk of missing surface variation that would have changed a development decision.
Bottleneck 3: Contact-Based Measurement Restricting Sample Compatibility
CMMs, stylus profilometers, and handheld roughness gauges all make physical contact with the sample. For hard, dimensionally stable surfaces this is rarely a concern. For the range of materials that R&D teams routinely work with, contact measurement introduces complications that add time, limit what can be measured, and in some cases compromise the data itself.
Soft polymers, elastomers, hydrogels, thin films, and biological or bio-inspired surfaces can deform under probe contact loads, even relatively light ones. When deformation occurs, the instrument is measuring a modified surface rather than the original one, which raises fundamental questions about data validity. Avoiding this requires either accepting measurement uncertainty, excluding those sample types from characterization, or investing in specialized low-force probe configurations that add cost and workflow complexity.
Sample preparation requirements add further overhead. Contact measurements often require surfaces to be clean and dry, parts to be fixtured or constrained to prevent movement under probe load, and fragile or irregular samples to be handled carefully to avoid damage during setup. In a high-iteration R&D workflow where samples move quickly between fabrication and characterization, that preparation time accumulates into a meaningful constraint.
Bottleneck 4: Single-Number Outputs That Don't Support Functional Characterization
Handheld roughness gauges return a single Ra value. Optical comparators return a projected edge profile. Neither provide the data that R&D surface characterization actually requires.
Ra, the arithmetic mean roughness along a single profile, is deeply embedded in manufacturing drawing callouts and is useful as a process control parameter in stable production environments. In R&D, where the goal is to understand how surface characteristics affect functional performance, such as friction, wear, coating adhesion, fatigue resistance, and fluid behavior, Ra alone is consistently insufficient. Two surfaces with identical Ra values can have completely different height distributions, texture directionality, and bearing area profiles, and can perform completely differently in service.
The parameter set required to characterize a surface for functional R&D purposes is defined in ISO 25178, the international standard for areal surface texture. It includes skewness (Ssk) for height distribution asymmetry, developed interfacial area ratio (Sdr) for coating adhesion, bearing ratio parameters (Spk, Svk) for tribological prediction, and texture direction parameters (Str, Std) for lay characterization. None of these can be calculated from a single Ra reading or a projected silhouette. Instruments that return only profile-based or single-number outputs are structurally incapable of supporting the analytical depth that R&D surface characterization demands.
Bottleneck 5: Instrument Access Constraints Delaying Time-Sensitive Characterization
CMMs are expensive, space-intensive instruments that are typically shared across departments and managed through formal scheduling systems. Stylus profilometers and optical comparators are more accessible but still subject to queuing when multiple researchers need instrument time in the same session. Handheld gauges are portable and available, but their output limitations mean they cannot substitute for more capable instruments when complete surface data is required.
The practical result is that measurement gets deferred to available instrument slots rather than performed when the data would be most valuable. This matters most at inflection points in a development program: immediately after a process change, when a new material batch arrives, or when a prototype has just come off a fabrication step and the team needs surface data before deciding whether to proceed. A delay of hours or days between fabrication and characterization introduces risk since surface conditions change; experimental context fades, and decisions get made on incomplete information.
Instrument access constraints also systematically push surface measurement later in the development cycle than it should be. Features that would have been caught and corrected early propagate further through the development program before they are identified, at which point the cost of correction is substantially higher.
The table below summarizes where R&D time is typically lost with common traditional tools.
| Traditional Tool | How It Collects Data | Where R&D Time Is Lost |
|---|---|---|
|
Stylus profilometer
|
How It Collects Data
One 2D line profile per trace
|
Where R&D Time Is Lost
Multiple traces and leveling needed to cover an area; contact risk on soft or coated samples
|
|
CMM with touch probe
|
How It Collects Data
Individual points, one at a time
|
Where R&D Time Is Lost
Programming for each new geometry; slow point-by-point collection; not suited to fine texture
|
|
Optical comparator or standard microscope
|
How It Collects Data
Operator's visual assessment
|
Where R&D Time Is Lost
Subjective results with limited quantitative data; outcomes vary by operator
|
|
Handheld roughness gauge
|
How It Collects Data
Short single-spot trace
|
Where R&D Time Is Lost
Limited coverage; repeated checks needed to characterize a full part
|
|
Manual data handling
|
How It Collects Data
Hand-transferred readings
|
Where R&D Time Is Lost
Exporting, spreadsheet entry, and report formatting after every session
|
What 3D Optical Profilometry Changes
3D optical profilometry provides real practical advantages to the bottlenecks that conventional tools like CMMs, optical comparators, handheld roughness gauges, and stylus profilometers face today. Instead of touching the surface with a probe or projecting a silhouette of its edge, optical profilometers use light to capture height data across an entire surface field in a single acquisition. Confocal laser scanning finds height from the intensity maximum at each XY position as the focal plane scans through the sample. Scanning white light interferometry measures optical path difference using broadband illumination. Both methods produce a complete areal height map without touching the sample.
Here's what that means in practice for each of the constraints above:
- Complete surface coverage: Full-field acquisition measures the whole field of view by default instead of sampling a single line or spot. Localized defects, coating variation, and texture non-uniformity are captured in the data rather than missed between traces.
- Throughput that keeps pace with sample generation: One acquisition replaces trace-by-trace scanning and multi-step CMM routines, returning a complete dataset in seconds. Teams can measure every sample, and more locations on each one, without cutting corners to keep up.
- Compatibility with delicate and unconventional materials: Because no probe touches the surface, soft polymers, elastomers, hydrogels, thin films, and fragile prototypes can be measured without deformation risk, specialized low-force setups, or extensive fixturing.
- Data that supports functional characterization: Areal height maps support the full ISO 25178 parameter set, including Ssk, Sdr, Spk, Svk, Str, and Std. That gives teams the height distribution, bearing area, and texture direction data needed to predict friction, wear, adhesion, and fluid behavior, which a single Ra value can't provide.
- Measurement when the data matters most: Fast acquisition and simple setup cut the instrument time each sample needs, which eases scheduling pressure and queues. Surface data can be collected right after a process change or fabrication step, so problems are caught early, when they're cheaper to fix.
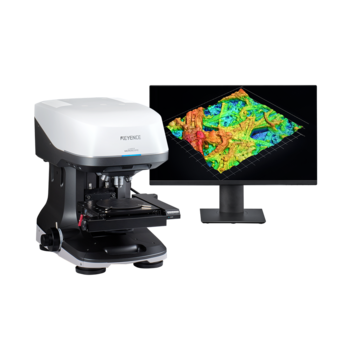
KEYENCE's VK-X4000 3D Optical Profilometer combines confocal and white light interferometry in a single system, delivering non-contact areal surface measurement across a wide range of sample types with full ISO 25178 parameter output. For R&D teams evaluating whether their current measurement workflow is keeping pace with their development cycle, understanding what faster, higher-coverage characterization would change is a practical starting point.
Frequently Asked Questions
Q What conventional instruments are used for surface measurement in R&D?
A
The most common conventional surface measurement instruments in R&D and manufacturing settings are coordinate measuring machines (CMMs), stylus profilometers, optical comparators, handheld roughness gauges, and optical microscopes. Each was designed for specific inspection tasks in manufacturing QC contexts and carries limitations when applied to the broader characterization demands of R&D workflows.
Q Why is Ra insufficient for R&D surface characterization?
A
Ra describes the arithmetic mean roughness along a single profile trace. It is useful as a process control parameter but insensitive to the height distribution, texture directionality, and bearing area characteristics that determine how a surface performs functionally. Two surfaces with identical Ra values can perform completely differently in service. ISO 25178 areal parameters including Ssk, Sdr, Spk, Svk, Str, and Std provide the functional characterization depth that Ra alone cannot.
Q What are the limitations of CMMs for surface texture measurement?
A
CMMs are highly capable dimensional measurement instruments but are not optimized for surface texture characterization. Their probe-based contact measurement approach, multi-step setup and programming requirements, and long per-part cycle times make them impractical as routine surface texture tools in high-iteration R&D workflows. They also return dimensional and form data rather than the areal surface texture parameters required for functional surface characterization.
Q Can 3D optical profilometry replace a CMM?
A
Not for all applications. CMMs remain the appropriate tool for high-accuracy dimensional measurement, geometric dimensioning and tolerancing verification, and inspection of complex three-dimensional part geometries where probe-based measurement at specific points is required. For surface texture characterization, roughness measurement, and topographic analysis, 3D optical profilometry provides more complete data with less setup time and greater sample compatibility.
Q Why does non-contact measurement matter for R&D samples?
A
R&D samples often include materials that contact-based instruments risk damaging: soft polymers, thin films, hydrogels, biological surfaces, and fragile or partially fabricated parts. Non-contact optical measurement applies no mechanical load to the sample, eliminating deformation risk and removing the need to evaluate whether a given material can tolerate the measurement process before proceeding.
Q How does 3D optical profilometry improve measurement throughput compared to conventional instruments?
A
Optical profilometers capture a full surface field in a single acquisition rather than building a map through sequential probe traces or multiple measurement points. This reduces per-sample acquisition time from minutes to seconds for typical surface areas, which directly increases the number of samples, locations, and conditions that can be characterized in a session without queuing or scheduling constraints.