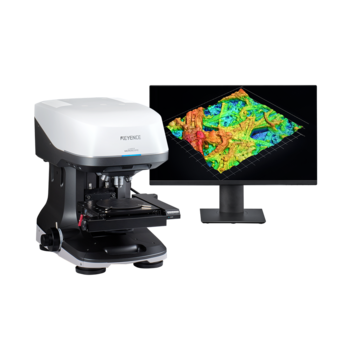
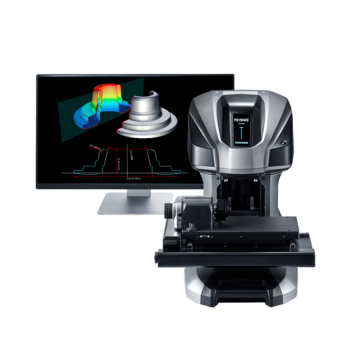
How Optical Profilers Improve Coating Adhesion
Key Takeaways
- Optical profilers for coating adhesion provide non-contact, repeatable surface measurements that support stronger, more consistent bond performance.
- Parameters such as Ra, Rz, Rsk, Sdr, and Svk each describe a different aspect of surface texture, all of which influence coating performance in distinct ways.
- Non-contact optical profiler technology measures delicate or prepared surfaces without risk of contamination or damage.
- Coating adhesion testing benefits from high-density 3D surface data collected both before and after the coating process.
- Optical profilers are used across automotive, aerospace, electronics, medical device, and industrial manufacturing applications.
Why Surface Texture Is Critical for Coating Adhesion
A coating is only as reliable as the surface it bonds to. Whether the application is a corrosion-resistant layer on a steel panel, a thermal barrier on a turbine blade, or a biocompatible film on a medical implant, the microscopic condition of the substrate determines how well that coating will adhere and perform over time.
Coating adhesion requires surface texture within a specific range. Too smooth, and the coating has insufficient mechanical grip, increasing the risk of delamination. Too rough, and deep valleys go unfilled, creating voids and stress concentration points that accelerate failure. The optimal profile depends on the coating type, application method, and end-use environment, and verifying that the preparation process has achieved it requires quantitative measurement.
Traditional methods such as visual blast panel comparisons and pull-off tests are either qualitative or only confirmatory after failure has already occurred. Optical profilers for coating adhesion address these gaps by delivering accurate, 3D surface data in seconds without ever touching the part.
Key Surface Parameters Measured by Optical Profilers
Understanding which parameters are relevant to coating adhesion helps teams set meaningful specifications and correlate surface condition to bonding outcomes. Modern optical profilers calculate both profile-based (2D) parameters per ISO 21920 and areal (3D) parameters per ISO 25178 from the same measurement dataset.
Ra and Rz — Mean Roughness and Profile Height
Ra, the arithmetic mean roughness, is the most widely specified surface roughness parameter and appears in the majority of coating preparation standards. It provides a useful baseline for surface acceptance, but because it averages all deviations, two surfaces with very different microscopic structures can share the same Ra value, making it insufficient as a sole acceptance criterion for adhesion-critical applications.
Rz is defined as the sum of the maximum peak height and maximum valley depth within the evaluation length and is significantly more informative. It captures the extremes of the surface profile: the deep valleys a coating must fill and the high peaks a thin coating must cover without bridging. For structural or thick coatings, Rz is often the primary specified parameter because it directly relates to whether the coating film thickness is sufficient to cover the full profile.
Rsk and Rku — Skewness and Kurtosis
These two parameters are among the most informative for coating adhesion and among the most frequently overlooked in standard specifications.
Rsk (skewness) describes the asymmetry of the height distribution along a profile. A negative Rsk value indicates a surface dominated by valleys with relatively flat plateaus between them, which is the type of profile that promotes mechanical interlocking and retains coating material effectively. A positive Rsk indicates sharp peaks with open valleys, which is less favorable because peaks may protrude through thin coatings and valleys may trap air rather than coating material. Blast-cleaned and etched surfaces typically exhibit negative skewness, which is one reason these preparation methods reliably produce strong adhesion.
Rku (kurtosis) describes the sharpness of profile features. High Rku values indicate sharp, pointed peaks and narrow valleys; lower values indicate broad, rounded features. Sharp peaks are more likely to protrude through thin coatings and create stress concentrations, while rounded features produce more uniform coverage. For thin-film applications in particular, Rku is a meaningful acceptance criterion that Ra alone cannot replace.
Sa, Sz, Ssk, and Sku — Areal Equivalents
Sa, Sz, Ssk, and Sku are the areal equivalents of Ra, Rz, Rsk, and Rku, calculated across the full 3D measurement area rather than along a single profile line. Because they incorporate far more data points, they are statistically more robust and capture spatial variation such as localized pits, directional texture and uneven blast patterns that a single profile trace may miss. For critical coating applications, areal parameters are increasingly preferred because they characterize the entire surface the coating will contact, not just a single cross-section.
Sdr — Developed Interfacial Area Ratio
Sdr quantifies the percentage increase in actual surface area relative to the projected flat area. A surface with Sdr = 0% is perfectly flat; a heavily blasted or etched surface may have an Sdr of 10–30% or higher. More actual surface area means more contact area for bonding, and higher Sdr values generally correlate with improved adhesion strength, particularly for chemically bonded coatings. Sdr also serves as a reliable indicator of preparation process consistency: a stable Sdr value across a production run confirms that the process is generating a reproducible texture.
Svk and Spk — Functional Valley and Peak Parameters
Svk and Spk are derived from the Abbott-Firestone material ratio curve and are defined in ISO 25178 as functional surface texture parameters.
Svk (reduced valley depth) describes the average depth of valleys below the core surface. For coating adhesion, Svk is one of the most directly meaningful parameters since deeper retention valleys improve mechanical keying and provide more volume for coating material to anchor into.
Spk (reduced peak height) describes the average height of peaks above the core surface. In thin coating applications, Spk indicates which peaks are most at risk of protruding through the coating film, creating localized weakness or areas where delamination may occur.
Evaluating Svk and Spk together gives process engineers a functional picture of the surface — how much valley volume is available for coating retention, and how prominent the peaks are relative to the intended coating thickness.
Benefits of Using Optical Profilers for Coating Adhesion Testing
Non-contact measurement eliminates the risk of scratching, contaminating, or deforming a prepared surface. Optical profilometry collects complete surface data non-destructively, so the part leaves in exactly the same condition it arrived in.
Repeatability removes the operator-dependent variability that affects manual inspection and contact stylus methods. Using optical profilers for coating adhesion delivers consistent results regardless of who operates the instrument.
Measurement speed enables quality control over an entire area instead of just individual points or lines. Modern optical profilers generate a full 3D surface map in seconds, transforming surface roughness measurement from periodic sampling into a continuous monitoring tool that detects process drift before out-of-spec parts accumulate.
Before-and-after measurement provides direct evidence of coating fill quality. A reduction in Sz or Svk after coating confirms that valleys have been filled, while persistent high Spk values may indicate incomplete coverage of the peak structure, which is information that a pull-off test cannot provide until after failure has already occurred.
Industry Applications
Automotive manufacturing depends on defined surface profiles to ensure paint, primer, and protective coatings resist corrosion and wear. Optical profilers verify preparation quality on body panels, engine components, and structural parts.
Aerospace and defense coatings must perform under extreme conditions. Pre-coat surface measurement is a standard requirement for turbine components, airframes, and landing gear, where optical profilometry provides the traceable data needed to qualify processes and demonstrate regulatory compliance.
Electronics and semiconductor manufacturing requires substrate characterization at the nanometer scale, where thin-film adhesion and device performance are directly influenced by surface conditions. Optical profilers with sub-nanometer vertical resolution evaluate substrates before film deposition or adhesive bonding.
Medical device manufacturing demands repeatable, documented measurement data for regulatory submissions and quality audits. Optical profilometry provides traceable surface roughness records while preserving the integrity of surfaces that cannot tolerate contact measurement.
Conclusion
Surface texture is one of the most consequential variables in any coating process and one that cannot be adequately characterized by a single parameter or visual inspection alone. Using optical profilers for coating adhesion can provide the full parameter set needed to evaluate preparation quality: from the baseline roughness of Ra and Sa, to the profile extremes of Rz and Sz, to the functional indicators of Ssk, Sdr, Svk, and Spk that most directly predict how a coating will bond and perform. As coating adhesion testing requirements become more rigorous across industries, optical profiler technology is an essential part of any complete surface quality program.
Frequently Asked Questions
Q What is an optical profiler, and how does it measure surface texture?
A
An optical profiler uses light rather than physical contact to measure surface height variations. It projects structured light or laser illumination onto the surface, captures the returned signal, and reconstructs a dense 3D height map that is analyzed to calculate standardized roughness and texture parameters per ISO 21920 and ISO 25178.
Q Which roughness parameters matter most for coating adhesion?
A
Rz or Sz set the profile height requirement. Rsk or Ssk confirm whether the surface is valley-dominant — the texture type that best supports mechanical interlocking. Sdr reflects the actual bonding area available, and Svk quantifies valley depth available for coating retention. Ra and Sa remain useful baseline thresholds but should not serve as the sole acceptance criteria when adhesion performance is critical.
Q How does surface roughness affect coating adhesion?
A
Surface roughness increases the real contact area between substrate and coating, improving mechanical interlocking and adhesion strength. The profile also needs to match the viscosity, film thickness, and application method of the coating being used. A profile that is too shallow provides insufficient grip; one that is too deep may not be fully wetted, leaving voids that initiate delamination.
Q Can optical profilers be used in production environments?
A
Yes and no. Some modern optical profilers can generate a full 3D surface map in seconds, which can typically support near-line quality control. However, high-speed production environments may be out of reach for most standalone profiling systems, particularly if very high measurement tolerances are needed. The appropriate configuration depends on part size, throughput requirements, and how the measurement integrates into the production workflow.
For more information about optical profiling solutions for coating adhesion measurement, contact a KEYENCE applications specialist.