When SEM Images Aren't Enough for 3D Surface Characterization
A scanning electron microscope produces some of the most detailed images available to materials scientists and quality engineers. Magnification into the tens of thousands or higher, nanometer-scale resolution, and exceptional depth of field make SEMs the default tool for inspecting fracture surfaces, coatings, and micro-features. But there's a limitation that catches many teams off guard: an SEM image, no matter how sharp, is fundamentally a 2D projection. When the question shifts from "what does this surface look like" to "how tall is that feature" or "what is the actual roughness value," an SEM alone can't answer it. That's where 3D surface measurement steps in, filling a gap that an SEM was never built to close.
Key Takeaways
- SEM surface analysis produces detailed images but doesn't deliver quantitative 3D data on its own.
- True 3D surface measurement requires a technique that captures calibrated Z-height at every point, such as confocal laser scanning or interferometry
- SEM and 3D surface characterization answer different questions: composition and fine morphology versus quantitative topography.
- Non-contact optical measurement offers fast, repeatable 3D results without touching or damaging the sample.
- Pairing SEM imaging with 3D surface measurement gives a fuller, more accurate view of material characteristics.
The Limitations of SEM Surface Analysis
Understanding the SEM Surface Analysis Principle
An SEM forms an image by scanning a focused electron beam across the sample and detecting secondary or backscattered electrons emitted from the surface. Signal intensity depends on beam-surface interaction angle, local topography, and material composition; signal intensity does not reflect calibrated height. The result is a grayscale map of contrast, not a coordinate map of elevation. This is the core limitation: engineers often try to estimate step heights from shadow length or brightness gradients in a secondary electron image, which works as a qualitative check but isn't a measurement. There's no Z-axis data behind the pixels, so two surfaces with identical visual texture in an SEM image can have completely different Ra or Sa values. Any roughness figure sourced purely from SEM inspection should be treated as an estimate, not a certified measurement.
What SEM Images Can and Cannot Measure
SEMs handle lateral detail beautifully, revealing grain boundaries, cracks, particle shape, and fine surface texture with remarkable clarity. What it can't do reliably is give you a precise Z-axis value. Without added hardware or software, there's no direct way to pull accurate height or depth numbers straight from a standard SEM image.
Stereo-pair SEM imaging, which captures two tilted images and triangulates height data, can approximate height, but it's slow, requires specialized software, and introduces its own geometric error. It was never designed as a production-floor metrology method, and its repeatability is highly dependent on operator skill and consistent imaging conditions.
A flat, 2D image can also hide a lot. Two surfaces might look nearly identical under an SEM yet have very different roughness profiles once actually measured. For teams tracking wear, coating thickness, or surface finish over time, that missing dimension can lead to inconsistent conclusions or data that can't be defended in a quality report.
How 3D Surface Measurement Complements SEM
Genuine 3D surface measurement requires a technique that captures calibrated height data at every point; not just contrast. Confocal laser scanning, interferometry, and structured-light systems all solve this by recording actual Z-height per pixel, producing a true height map rather than an inferred one. That distinction matters for anything downstream: Sa/Sq roughness parameters, volumetric wear analysis, step-height verification, or feeding dimensional data into a CAD comparison.
It helps to think of SEM and 3D surface characterization as answering different questions rather than competing for the same job. SEMs excel at composition, fine morphology, and features below optical resolution. A 3D surface measurement system excels at quantitative topography: height, volume, roughness, and area-based statistics traceable to a calibration standard. Most demanding applications ultimately need both.
Measuring Surface Roughness and Height
Improving 3D Surface Characterization with Optical Metrology
Optical metrology tools such as confocal and laser scanning systems measure height directly rather than inferring it. These instruments scan a surface and record precise elevation data at every point, producing a true topographic map instead of an approximation built from shading cues. The result is Sa/Sq/Sz roughness parameters, volumetric analysis, and step-height data that hold up to traceable metrology standards.
When to Use SEM vs. 3D Surface Measurement
The right tool depends on what you need to know. A practical guide:
- Reach for SEM when you need to identify fine surface features, contamination, material composition, or any feature below optical resolution (~100 nm).
- Reach for 3D measurement when the question is about height, depth, roughness, or volume; numbers that SEMs alone can't reliably supply.
- Use both when the investigation requires visual identification of a defect AND quantification of its geometry, which is common in failure analysis, coating evaluation, and materials research.
Combining SEM Imaging with 3D Surface Characterization
A common two-step workflow in failure analysis and materials research uses SEM to identify a defect visually, then switches to an optical instrument to quantify its exact depth or roughness value. This approach is particularly effective because it plays to each instrument's strengths: SEM for morphology and composition, 3D measurement for traceable quantitative data.
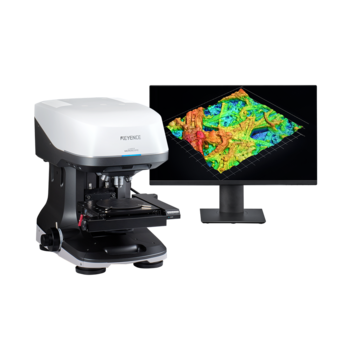
For a meaningful share of research, QC, and inspection tasks, however, an industrial laser scanning confocal system does not just supplement SEM; in many cases it can substitute for it. KEYENCE's VK-X series produces high-contrast images at high magnification with sub-micron lateral resolution, enough to resolve fine surface features without the vacuum chamber, conductive coating, or charging artifacts that SEM sample prep typically requires. Samples can be loaded and imaged in seconds rather than going through sputter-coating and pump-down time. For work that does not call for elemental analysis (EDS) or resolution below roughly 100 nm, a VK system can deliver publication-quality imaging and calibrated 3D height data in the same non-destructive session, removing an entire instrument and prep cycle from the workflow.
Best Practices for Complete Surface Analysis
- Establish a 3D baseline first. Measure surface roughness and topography before SEM imaging, since electron beam exposure can alter some sensitive samples.
- Use SEM for identification, 3D measurement for quantification. Let each instrument do what it does best rather than forcing one to approximate the other's output.
- Match your roughness parameter to the question. Ra and Rz describe a profile line; Sa and Sz describe an area. For most modern QC and research applications, areal parameters (ISO 25178) are more representative.
- Verify calibration traceability. Unlike SEM imaging, 3D surface measurement outputs are expected to be traceable to a calibration standard, so confirm your instrument's calibration status before citing roughness data in a quality report.
- Consider sample prep compatibility. Non-contact optical systems measure samples as-received; SEM often requires conductive coating. If you need both, SEM should typically come last to avoid altering the surface.
Frequently Asked Questions
Q Can an SEM measure surface roughness directly?
A
Not quantitatively. Standard SEM imaging is a 2D grayscale projection with no calibrated height axis, so any roughness value read from it is an estimate rather than a traceable measurement.
Q What's the difference between SEM surface analysis and 3D surface measurement?
A
SEM surface analysis characterizes composition and fine morphology through electron-beam imaging. 3D surface measurement via confocal, focus-variation, or interferometry captures calibrated height data at every point, enabling quantitative roughness and volumetric analysis.
Q Is measuring roughness with a scanning electron microscope possible at all?
A
Only indirectly, via stereo-pair imaging and photogrammetric reconstruction, a slow, specialized process not intended for routine QC. A dedicated 3D surface measurement system is the standard approach when traceable roughness data is required.
Q Can a laser scanning confocal system replace an SEM entirely?
A
For many QC and imaging tasks, yes. Systems like the KEYENCE VK-X series produce high-contrast images at high magnification with sub-micron lateral resolution, sufficient for most surface inspection needs without vacuum or conductive coating. SEM remains the better choice when sub-100 nm resolution or elemental composition data (EDS) is required.