How to Determine Cell Confluency with a Fluorescence Microscope
Accurate cell confluency measurement is essential for maintaining healthy cell cultures and ensuring reliable experimental outcomes. Digital fluorescence microscopes simplify the process by enabling consistent image capture and analysis while reducing subjective estimates. By following proper imaging practices and using appropriate measurement tools, researchers can improve accuracy and make more informed decisions about passaging, treatment timing, and cell culture management.
Key Takeaways
- Cell confluency measures how much of a culture surface is covered by cells.
- Digital fluorescence microscopes help capture consistent images for confluency analysis.
- Software tools can improve accuracy compared with manual visual estimates.
- Consistent lighting, focus, and field selection help produce reliable results.
- Accurate confluency measurements support better timing for passaging, so cultures aren't split too early or too late.
The procedure is familiar to anyone who has managed a cell culture lab: examine the sample with the microscope, and determine whether splitting is necessary. The rapid visual inspection is actually an estimate of cell confluency, and most people are unaware of how important it is to get it properly. An experiment pauses if there is insufficient confluency. When there is too much, cells begin to compete for space, which alters their behavior.
What Is Cell Confluency?
The percentage of a culture surface that is covered by cells is known as confluency. At 50% confluency, around half of a medium's surface is covered, but there is still room between colonies. At 90% or more, the cells in a medium are almost packed edge to edge, contacting one another on most sides.
Many daily lab choices are based on this figure. Certain cell types must be divided well before they are completely covered, as crowding can alter gene expression or growth rate. Higher confluency is easily tolerated by others. In any case, outcomes are more consistent from one passage to the next when the real proportion is known instead of speculating based on a cursory inspection.
Why Cell Confluency Measurement Matters
For a typical passage, a crude eyeball estimate could be adequate, but in more complex work, it begins to come apart. Protocols for drug screening, transfection timing, and differentiation frequently require cells at a particular confluency window, sometimes within a small range, such as 60 to 70 percent. If you miss that window, the experiment as a whole may yield erratic or untrustworthy results.
Additionally, cell confluency measurement helps laboratories standardize their work across multiple technicians and shifts. A person's "looks about 70% full" may differ greatly from another's. Much of the uncertainty is eliminated by a quantitative, image-based method, which is important when results must be consistent over several trials or when compared to established procedures.
How to Measure Cell Confluency with a Fluorescence Microscope
Wondering how to measure cell confluency without relying on a rough guess? The quick solution is to take a clear picture and compare the covered region to the entire field. Compared to a regular light microscope, a fluorescence microscope makes this easier since fluorescent labeling may clearly show cell borders or nuclei for precise counting or area computation.
Three phases make up the typical workflow: take a picture, assess the covered area, and use software to calculate the numbers instead of making an educated guess. Every step counts, and omitting one typically results in less trustworthy outcomes.
Capture Consistent Cell Images
A good image is the foundation of good measurement. Because brightness changes can confuse automated analysis techniques that rely on contrast between cells and the backdrop, maintain consistent illumination during each capture session. Concentration is equally important. A slightly fuzzy photograph might completely conceal microscopic colonies or make a sparse culture appear thicker than it actually is.
Additionally, choose your fields consistently. Results may be skewed if a single photograph is taken at the center of a flask and treated as typical, particularly if cells develop irregularly near the margins. To average out any local fluctuation, most labs agree on a pattern, such as taking three or four fields per flask at predetermined points.
Estimate Covered Surface Area
Once the image is captured, the next step is figuring out how much of the field is actually covered. This can be done visually, by comparing the image against reference charts showing common confluency percentages, but that method still carries some subjectivity. A trained eye gets closer with practice, though even experienced researchers vary by a few percentage points on the same image.
Instead of making a judgment, a more trustworthy method treats the image as data. By separating cell-covered pixels from open background pixels, threshold-based analysis provides a percentage based on actual pixel counts rather than an estimate.
Use Software to Calculate Confluency
This is where how to measure confluency of cells shifts from an art to a repeatable process. Image analysis software can scan a captured field, detect the boundary between cells and open space, and automatically output a confluency percentage. Many digital microscope platforms include this kind of built-in analysis, cutting out the need for a separate program entirely.
A fluorescence microscope with integrated software can also save each measurement alongside the image, building a record that's easy to review later or share with a supervisor. That kind of paper trail matters when a protocol needs to be reproduced exactly, or when a result gets questioned months down the line.
Best Practices for Accurate Measurements
Reliable confluency data may be achieved with a few behaviors. Before every session, adjust the microscope's magnification and scale parameters, as even a small setup error can affect all readings. Additionally, maintain a consistent imaging schedule, as measuring confluency at drastically different times of day may introduce fluctuations due to incubator conditions rather than true development.
To ensure that repeated observations of the same flask remain consistent, it is also helpful to record the exact fields photographed each time. These kinds of little, regular practices improve accuracy more than any one piece of software.
Common Cell Confluency Measurement Mistakes
In labs unfamiliar with structured confluency measurement, a few errors recur. The most popular approach is to just rely on a visual estimate, which introduces variability across individuals and even between sessions for the same individual. Another common problem is inconsistent illumination, particularly in labs where numerous projects with varying setup preferences share microscope time.
Although it is a less noticeable error, sampling too few fields is important. It is unusual for a single photograph taken from one corner of a flask to accurately depict the entire culture, especially in flasks with uneven development. Because the mistake often appears modest until results start drifting over multiple passes, skipping calibration checks can also throw off readings without anyone realizing it right away.
The list concludes with bad picture-storing practices. Labs frequently find it difficult to track down an unexpected result later on if they do not maintain a precise record of which picture corresponds to which flask, date, and passage number. When a protocol needs to be reviewed months later, a straightforward naming convention combined with software that automatically logs measurements saves a lot of trouble.
Frequently Asked Questions
Q What is cell confluency?
A
Cell confluency is the percentage of a culture surface covered by cells, used to judge how full or sparse a flask or dish is.
Q How do you measure cell confluency?
A
Capture a clear image of the culture, then compare the cell-covered area to the total field, either visually or through image analysis software.
Q Can a fluorescence microscope measure cell confluency?
A
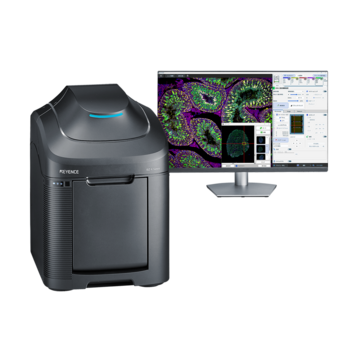
Yes. Software can more easily determine an accurate confluency percentage when cell borders or nuclei are highlighted by fluorescence labeling. Check out the BZ-X Series Fluorescence Microscope to learn how you can optimize this process. KEYENCE also has the BC Series which automated cell counting.
Q Why is cell confluency important in cell culture?
A
It helps researchers time passaging correctly and keep experimental conditions consistent, since overcrowded or too-sparse cultures can behave differently than expected.