What Is 3D Surface Texture Analysis? A Guide for R&D Teams
Surface texture analysis is the quantitative measurement of a material's surface topography, capturing the fine geometric detail including peaks, valleys, slopes, and patterns that determine how a surface performs in use. It produces numerical data describing roughness, waviness, and lay, which engineers and researchers use to evaluate manufacturing quality, predict functional performance, and guide product development decisions.
Unlike visual inspection or simple pass/fail gauging, surface texture analysis generates traceable, repeatable measurements that can be compared across batches, tracked over time, and tied directly to functional outcomes such as friction, wear resistance, sealing effectiveness, and coating adhesion.
Key Takeaways
- Surface texture analysis quantifies surface geometry using standardized parameters defined in ISO 25178 (areal) and ISO 21920 (profile).
- 3D areal measurement captures an entire surface field at once. A single 2D stylus trace samples roughly 0.1% of a typical inspection area, making localized defects statistically likely to be missed.
- The choice of measurement parameters matters as much as the measurement itself. Two surfaces can share an identical Ra value while performing completely differently in service.
- Non-contact optical methods, including confocal laser scanning microscopy and white light interferometry, eliminate tip wear and sample damage while enabling full-area 3D data collection.
- Accurate surface characterization compresses development cycles by replacing iterative physical testing with quantitative data at each stage of design and process refinement.
What Surface Texture Analysis Measures
A surface is never geometrically simple, even when it appears smooth. The features that make up surface texture are divided into three spatial components: roughness, waviness, and lay.
Roughness
Roughness refers to the fine, closely spaced irregularities left by the manufacturing process itself, including tool marks, grain boundaries, or the crystalline structure of the material. Roughness is the component most directly linked to tribological performance: friction, wear, and lubrication behavior all correlate with roughness characteristics at the microscale.
Waviness
Waviness describes longer-wavelength undulations that sit above roughness in scale but below the overall form of the part. Waviness typically originates from machine vibration, thermal effects during processing, or material springback. It affects sealing performance and contact mechanics in assembled components.
Lay
Lay refers to the predominant direction of the surface texture pattern, typically determined by the manufacturing process. A milled surface has a lay aligned with the tool path; a ground surface has a lay perpendicular to the grinding direction; an isotropic surface such as a shot-peened or EDM-finished part has no predominant lay direction.
Lay matters functionally because friction, wear, and fluid flow behavior can differ significantly depending on the direction of relative motion across the surface. It also matters metrologically: a 2D profile trace taken parallel to the lay direction will report very different roughness values than one taken perpendicular to it. This directional sensitivity is one of the core reasons areal measurement is more reliable than profile measurement for surfaces with a strong directional texture.
Separating the Three Components: Filtering
Separating roughness, waviness, and form from raw surface data requires applying spatial filters with defined cutoff wavelengths. The cutoff wavelength lambda-c governs the roughness/waviness boundary; lambda-f governs the waviness/form boundary. The choice of cutoff significantly affects the resulting parameter values. Two measurements of the same surface using different filter cutoffs can produce substantially different roughness figures, which is a common source of inter-lab disagreement and a reason why reporting filter settings alongside parameter values is required under ISO 25178.
Contact vs. Non-Contact Measurement Methods
Two fundamental approaches exist for capturing surface texture data. The physics of each impose different constraints on what they can and cannot measure reliably.
Contact Profilometry
Contact profilometry uses a stylus with a diamond tip, typically 2 to 5 micrometers in radius, dragged across the surface under a controlled load. The vertical displacement of the stylus is recorded as it traverses the surface, producing a 2D height profile along that single line. Contact profilometry is well-established, traceable to national length standards, and embedded in many manufacturing inspection workflows and drawing callout conventions.
Its limitations are structural. A single trace captures one line across the surface, leaving the remainder of the area unmeasured. Tip radius limits the system's ability to resolve features narrower than the tip geometry. On soft, compliant, or delicate materials, the stylus load can deform or scratch the surface. Building a 3D map requires multiple parallel traces, making full-area contact measurement slow relative to optical methods.
Non-Contact Optical Profilometry
Non-contact optical profilometry replaces the physical stylus with light. The two dominant techniques in surface texture metrology are confocal laser scanning microscopy (CLSM) and scanning white light interferometry (SWLI), each operating on different physical principles with different performance envelopes.
Confocal systems use a pinhole aperture to reject out-of-focus light, extracting height from the intensity maximum as the focal plane is scanned through the sample axially. This approach handles steep slopes (over 85 degrees in high-NA configurations), rough surfaces, and low-reflectance materials more tolerantly than interferometry.
SWLI measures optical path difference using broadband illumination. Coherence envelope detection yields vertical resolution below 1 nm on smooth surfaces, making it the preferred method for optical components, thin-film step heights, and any application where sub-nanometer height discrimination is required. Its limitation is sensitivity to slope: most SWLI systems lose reliable signal above approximately 10 to 20 degrees.
Both optical methods capture a full field of view in a single measurement rather than a single line, enabling true 3D areal data collection. Neither method contacts the sample, eliminating tip wear, sample damage, and the geometric limitations imposed by finite stylus radius.
Surface Texture Parameters: Choosing the Right Metrics
Parameter selection is where surface texture analysis most often goes wrong in practice. Defaulting to Ra or Sa because they are familiar produces numbers that are easy to report but frequently insufficient to predict or explain functional behavior.
Profile Parameters (ISO 21920)
Profile parameters are calculated from a single 2D trace. Ra (arithmetic mean roughness) is the most widely used, describing the average absolute deviation of the height profile from the mean line. Rz describes the average of the five largest peak-to-valley heights within the measurement length. These parameters are deeply embedded in manufacturing standards and drawing callouts but carry the fundamental limitation of all profile methods: they describe one line, not the surface.
Areal Parameters (ISO 25178)
Areal parameters extend profile concepts across the full measured area and introduce additional metrics that profile measurement cannot provide.
- Sa: the areal equivalent of Ra: the arithmetic mean height deviation across the entire measured field.
- Sq: root mean square height, more sensitive to outlying peaks and valleys than Sa, making it a better indicator of surfaces where extreme features matter functionally.
- Ssk: skewness, which describes the asymmetry of the height distribution. A negative Ssk indicates a surface dominated by valleys relative to its mean plane, typical of plateau-honed surfaces designed for oil retention. A positive Ssk indicates sharp peaks, common in as-machined or as-cast surfaces. Two surfaces with identical Sa can have opposite Ssk values and perform completely differently under sliding contact.
- Sku: kurtosis, which describes the sharpness of the height distribution. High kurtosis surfaces have sharp, isolated peaks or deep narrow valleys; low kurtosis surfaces have a more uniform texture. Sku is relevant for contact mechanics and predicting wear initiation sites.
- Spd and Spc: peak density and arithmetic mean peak curvature, which quantify how many contact points a surface presents and how sharp they are. These parameters directly govern contact area, friction, and lubricant film behavior.
- Sdr: developed interfacial area ratio, which expresses the percentage by which the actual surface area exceeds the projected flat area. Sdr correlates with coating adhesion and surface wettability: a higher Sdr means more physical area for a coating to bond to.
- Sk parameters (Sk, Spk, Svk): derived from the Abbott-Firestone bearing ratio curve and particularly relevant for tribological surfaces. Spk (reduced peak height) represents the asperity peaks that will wear away during run-in; Sk (core roughness depth) represents the stable bearing surface; Svk (reduced valley depth) represents the valleys available for lubricant retention.
Texture Direction Parameters (Lay)
Lay is characterized in ISO 25178 through two dedicated areal parameters that quantify texture directionality across the full measured field, rather than along a single profile trace.
- Str: texture aspect ratio, which describes how strongly directional the surface is on a scale of 0 to 1. A value close to 0 indicates a strongly directional surface with a clear lay, typical of ground or milled finishes. A value close to 1 indicates a near-isotropic surface with no dominant direction, typical of shot-peened or EDM-finished surfaces. Str is practically useful for confirming that a finishing process produced the expected texture character and for detecting when a nominally isotropic process has introduced unexpected directionality.
- Std: texture direction, which quantifies the dominant lay angle of the surface in degrees, derived from the Fourier transform of the areal height data. It identifies the predominant direction of the surface pattern relative to a reference axis, enabling precise characterization of tool path direction, grinding lay, or any other directionally imposed texture.
Together, Str and Std close the gap between the conceptual definition of lay and its quantitative measurement. Without these parameters, a surface texture report characterizes amplitude but says nothing about directionality, which is a meaningful omission for any application where functional performance depends on the orientation of relative motion across the surface.
Why 3D Areal Measurement Outperforms 2D Profile Measurement
The case for 3D surface analysis is not simply that it produces a more complete picture. It is that 2D profile measurement is statistically inadequate for detecting the surface features most likely to cause functional problems.
A standard 2D stylus trace across a 10 mm surface using a 0.8 mm cutoff wavelength samples a strip approximately 5 micrometers wide. On a 10 mm x 10 mm surface, that trace covers roughly 0.05% of the total area. A localized defect, a scratch, a pit, or a patch of anomalous texture from a process variation can exist on the surface without intersecting the measurement path.
3D areal measurement captures the entire field of view in a single acquisition. Defects are not missed because the measurement happened to avoid them; they appear in the data or they are not there. This completeness matters most in failure analysis, where the cause of a problem often lies in a localized surface anomaly rather than a uniform texture change, and in R&D, where characterizing a new material or process requires confidence that the measurement reflects the actual surface rather than one arbitrarily sampled line across it.
Areal measurement also enables spatial analysis that profile measurement cannot support: identifying lay direction and isotropy via Str and Std, mapping texture uniformity across a part, and detecting periodic features such as machining marks or grinding patterns that only become visible when the full surface is characterized.
Applications of 3D Surface Metrology in R&D
Material and Coating Evaluation
Surface texture governs coating performance before the coating is ever applied. Adhesion strength, film uniformity, and long-term durability all depend on the substrate texture beneath the coating. Measuring Sa, Sdr, and Ssk before and after surface preparation, and again after coating application, provides quantitative confirmation that the substrate and process are within specification. A higher Sdr increases the physical bonding area available to the coating; Ssk confirms the surface profile is valley-dominated rather than peak-dominated, which affects how evenly the coating distributes across the substrate.
For new material development, surface texture data characterizes how a material's microstructure manifests at the surface and how it changes under processing conditions. Comparing texture parameters across material batches or heat treatment conditions produces data that correlates directly with downstream performance.
Failure Analysis and Product Development
When a part fails in the field, surface texture data can distinguish between a design problem, a manufacturing process problem, and a material problem. Abnormal wear patterns, unexpectedly high roughness on a bearing surface, or surface damage inconsistent with the specified finishing process all leave measurable traces in the texture data. Changes in Spk indicate accelerated peak wear; shifts in Svk suggest loss of lubricant retention capacity; changes in Std can reveal that a surface was finished in the wrong orientation relative to the direction of service loading.
During development, the same measurements allow engineers to iterate on surface finish specifications with data rather than intuition. Setting a roughness callout on a drawing based on actual measured performance of a prototype, rather than applying a rule of thumb, reduces the risk of over-specifying (which adds cost) or under-specifying (which adds failure risk).
Manufacturing Process Optimization
Surface texture is a sensitive indicator of process state. Tool wear in machining increases Ra and Rz progressively and predictably. Changes in grinding wheel condition alter the Sk parameter distribution. Coating process drift changes Sdr. A shift in Str toward more directional values on a nominally isotropic surface can indicate process instability before any dimensional non-conformance is detectable.
Establishing texture baselines for a stable process and tracking key parameters over production runs creates an early warning system for process drift, allowing manufacturers to intervene before parts move outside specification.
Choosing a Surface Texture Measurement System
The right system is determined by the surface characteristics of the application, not by instrument specifications in isolation. The following criteria should drive the selection.
- Surface slope and geometry: if the surfaces being measured include steep walls, sharp edges, or high-aspect-ratio features, confocal laser scanning microscopy handles these geometries reliably. SWLI becomes unreliable above approximately 10 to 20 degrees of local slope. Contact profilometry cannot access undercut features at all.
- Required vertical resolution: for applications requiring sub-nanometer height measurement such as optical surfaces, thin films, and step heights below 10 nm, SWLI provides the resolution floor that confocal and general contact methods cannot match. For rougher surfaces in the 100 nm to 10 micrometer range, confocal and contact profilometry are both adequate.
- Material reflectivity: SWLI depends on coherent reflection; low-reflectance materials degrade fringe contrast and measurement reliability. Confocal profilometry is more tolerant of varied reflectivity and has no optical dependency. Optical methods also have the added benefit of being able to characterize and measure the thickness of transparent films.
- Sample fragility: soft polymers, biological samples, thin films, and precision optical surfaces should not be measured with contact methods. Non-contact optical measurement eliminates any risk of surface deformation or damage.
- Measurement area and acquisition time: if the inspection workflow requires characterizing large areas, multiple samples per session, or rapid iteration, optical areal methods are substantially faster than contact profilometry for equivalent surface coverage.
- Standards compliance: if measurements will be reported against drawing callouts, submitted in regulatory filings, or compared across labs, confirm that the instrument outputs are traceable to national standards and compliant with ISO 25178 or ISO 21920 as appropriate for the application.
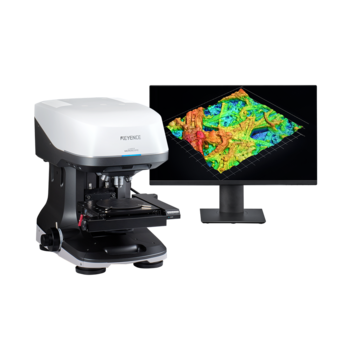
KEYENCE's laser microscope systems combine confocal imaging with full ISO 25178 areal parameter output, non-contact measurement, and a measurement toolset designed for the range of surface types R&D teams encounter. This industrial surface measurement resource covers implementation in more depth.
Frequently Asked Questions
Q What is surface texture analysis?
A
Surface texture analysis is the quantitative measurement of a surface's geometric fine structure, specifically its roughness, waviness, and lay, using standardized parameters and calibrated instruments. It produces numerical data traceable to national length standards that can be used for quality control, functional performance prediction, and process monitoring. It differs from visual inspection in that it is objective, repeatable, and sensitive to features well below the threshold of human vision.
Q How does 3D surface analysis differ from 2D profile measurement?
A
2D profile measurement captures height data along a single line across the surface, typically using a stylus profilometer. 3D surface analysis captures height data across an entire area in a single measurement. The practical difference is coverage: a standard 2D trace samples a fraction of a percent of the total surface area, making it statistically likely to miss localized defects or texture variation. 3D areal measurement characterizes the full surface field, enabling spatial analysis of texture patterns including lay direction via Str and Std, defect detection, and areal parameter calculation per ISO 25178.
Q What is surface texture measurement used for?
A
Surface texture measurement is used to evaluate roughness and finish quality in manufactured parts, assess coating adhesion and substrate preparation, analyze wear and failure mechanisms in returned components, monitor process stability in production environments, and characterize new materials during R&D. The specific parameters measured depend on the functional property of interest: tribological surfaces require different parameters than optical surfaces or sealing interfaces.
Q What is 3D surface metrology?
A
3D surface metrology is the discipline of measuring surface topography in three dimensions, quantifying height variation across an area rather than along a single line. It encompasses both contact methods (3D stylus scanning via parallel traces) and non-contact optical methods (confocal microscopy, white light interferometry, focus variation). The governing international standard for areal surface texture measurement is ISO 25178, which defines parameter calculations, filtration procedures, calibration requirements, and instrument classification.
Q What surface texture parameters should I use?
A
Parameter selection depends on the functional performance characteristic of interest. Ra or Sa (mean roughness) is a useful baseline but insufficient on its own for most functional specifications. For tribological surfaces, Ssk, Sk, Spk, and Svk provide information about bearing area and lubricant retention that Ra cannot. For coated surfaces, Sdr correlates with adhesion performance. For surfaces where peak sharpness affects contact mechanics, Sku and Spc are relevant. For any surface where the direction of texture matters functionally, Str and Std should be included to characterize lay. Reporting only Ra or Sa on a drawing callout is common but often inadequate for performance-critical applications.
Q What is the difference between roughness and waviness?
A
Roughness and waviness are separated by spatial filtering. Roughness refers to the short-wavelength, closely spaced surface irregularities produced by the manufacturing process, tool feed, or material grain and can affect friction, wear, and adhesion. Waviness refers to longer-wavelength undulations typically caused by machine vibration, thermal effects, or material behavior during processing and can affect sealing, noise, and fatigue life. The cutoff wavelength (lambda-c) applied during data processing determines where the boundary between roughness and waviness falls. The same raw surface data will yield different roughness and waviness values depending on the filter cutoff applied, which is why filter settings must be reported alongside measurement results.
Q What is lay, and why does it matter?
A
Lay is the predominant direction of the surface texture pattern, determined by the manufacturing process. Ground surfaces have a directional lay perpendicular to the grinding direction; milled surfaces have a lay aligned with the tool path; isotropic processes such as EDM or shot peening produce surfaces with no dominant lay direction. Lay matters because the functional behavior of a surface under load, particularly friction and wear, often depends on the orientation of relative motion relative to the texture direction. In measurement terms, lay is quantified using the ISO 25178 parameters Str (texture aspect ratio) and Std (texture direction), which together describe both the strength and the angle of the dominant texture direction across the full measured surface area.