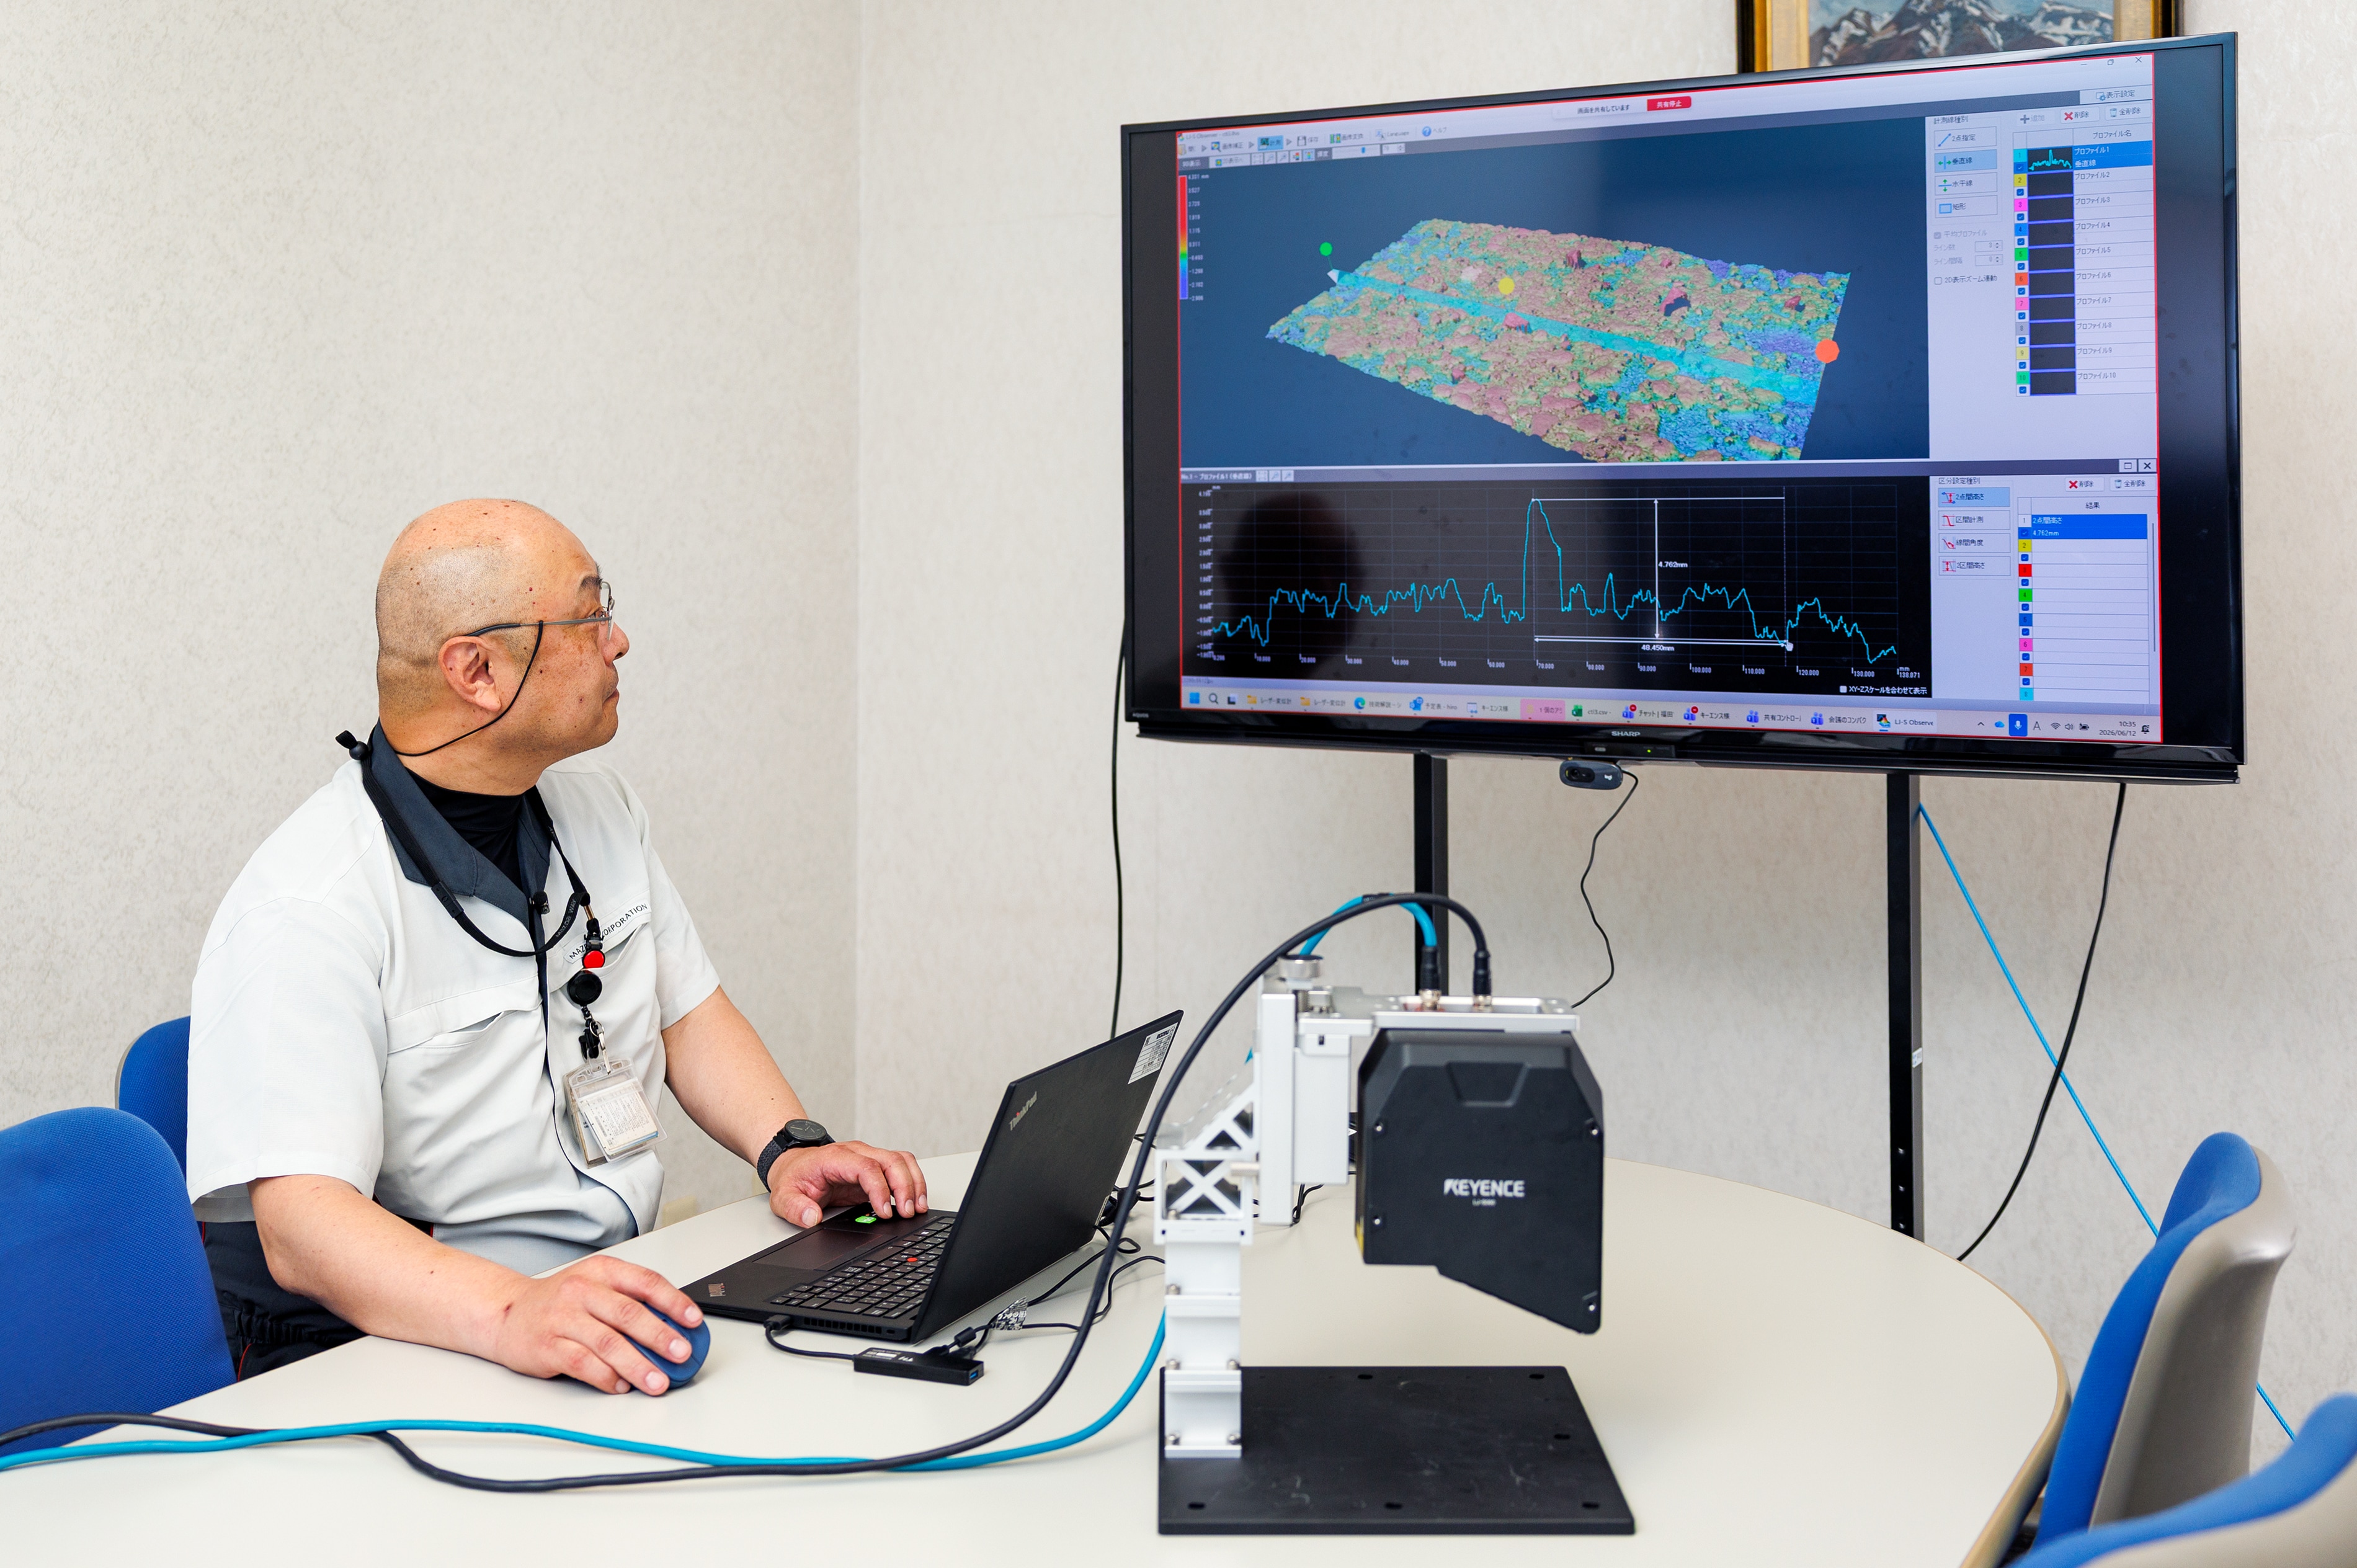
Mazda Motor Corporation builds cars around its own philosophy of Jinba Ittai — horse and rider as one — combining the joy of driving with environmental and safety performance. To analyze the factors behind running resistance, which underpins fuel economy evaluation, the company measures the unevenness of its test course with the KEYENCE 3D Laser Snapshot Sensor LJ-S8000 Series, capturing the road as an area rather than a line. Measurement points that were hard to secure through outsourcing can now be taken in-house, and the reliability of running-resistance data has improved significantly.
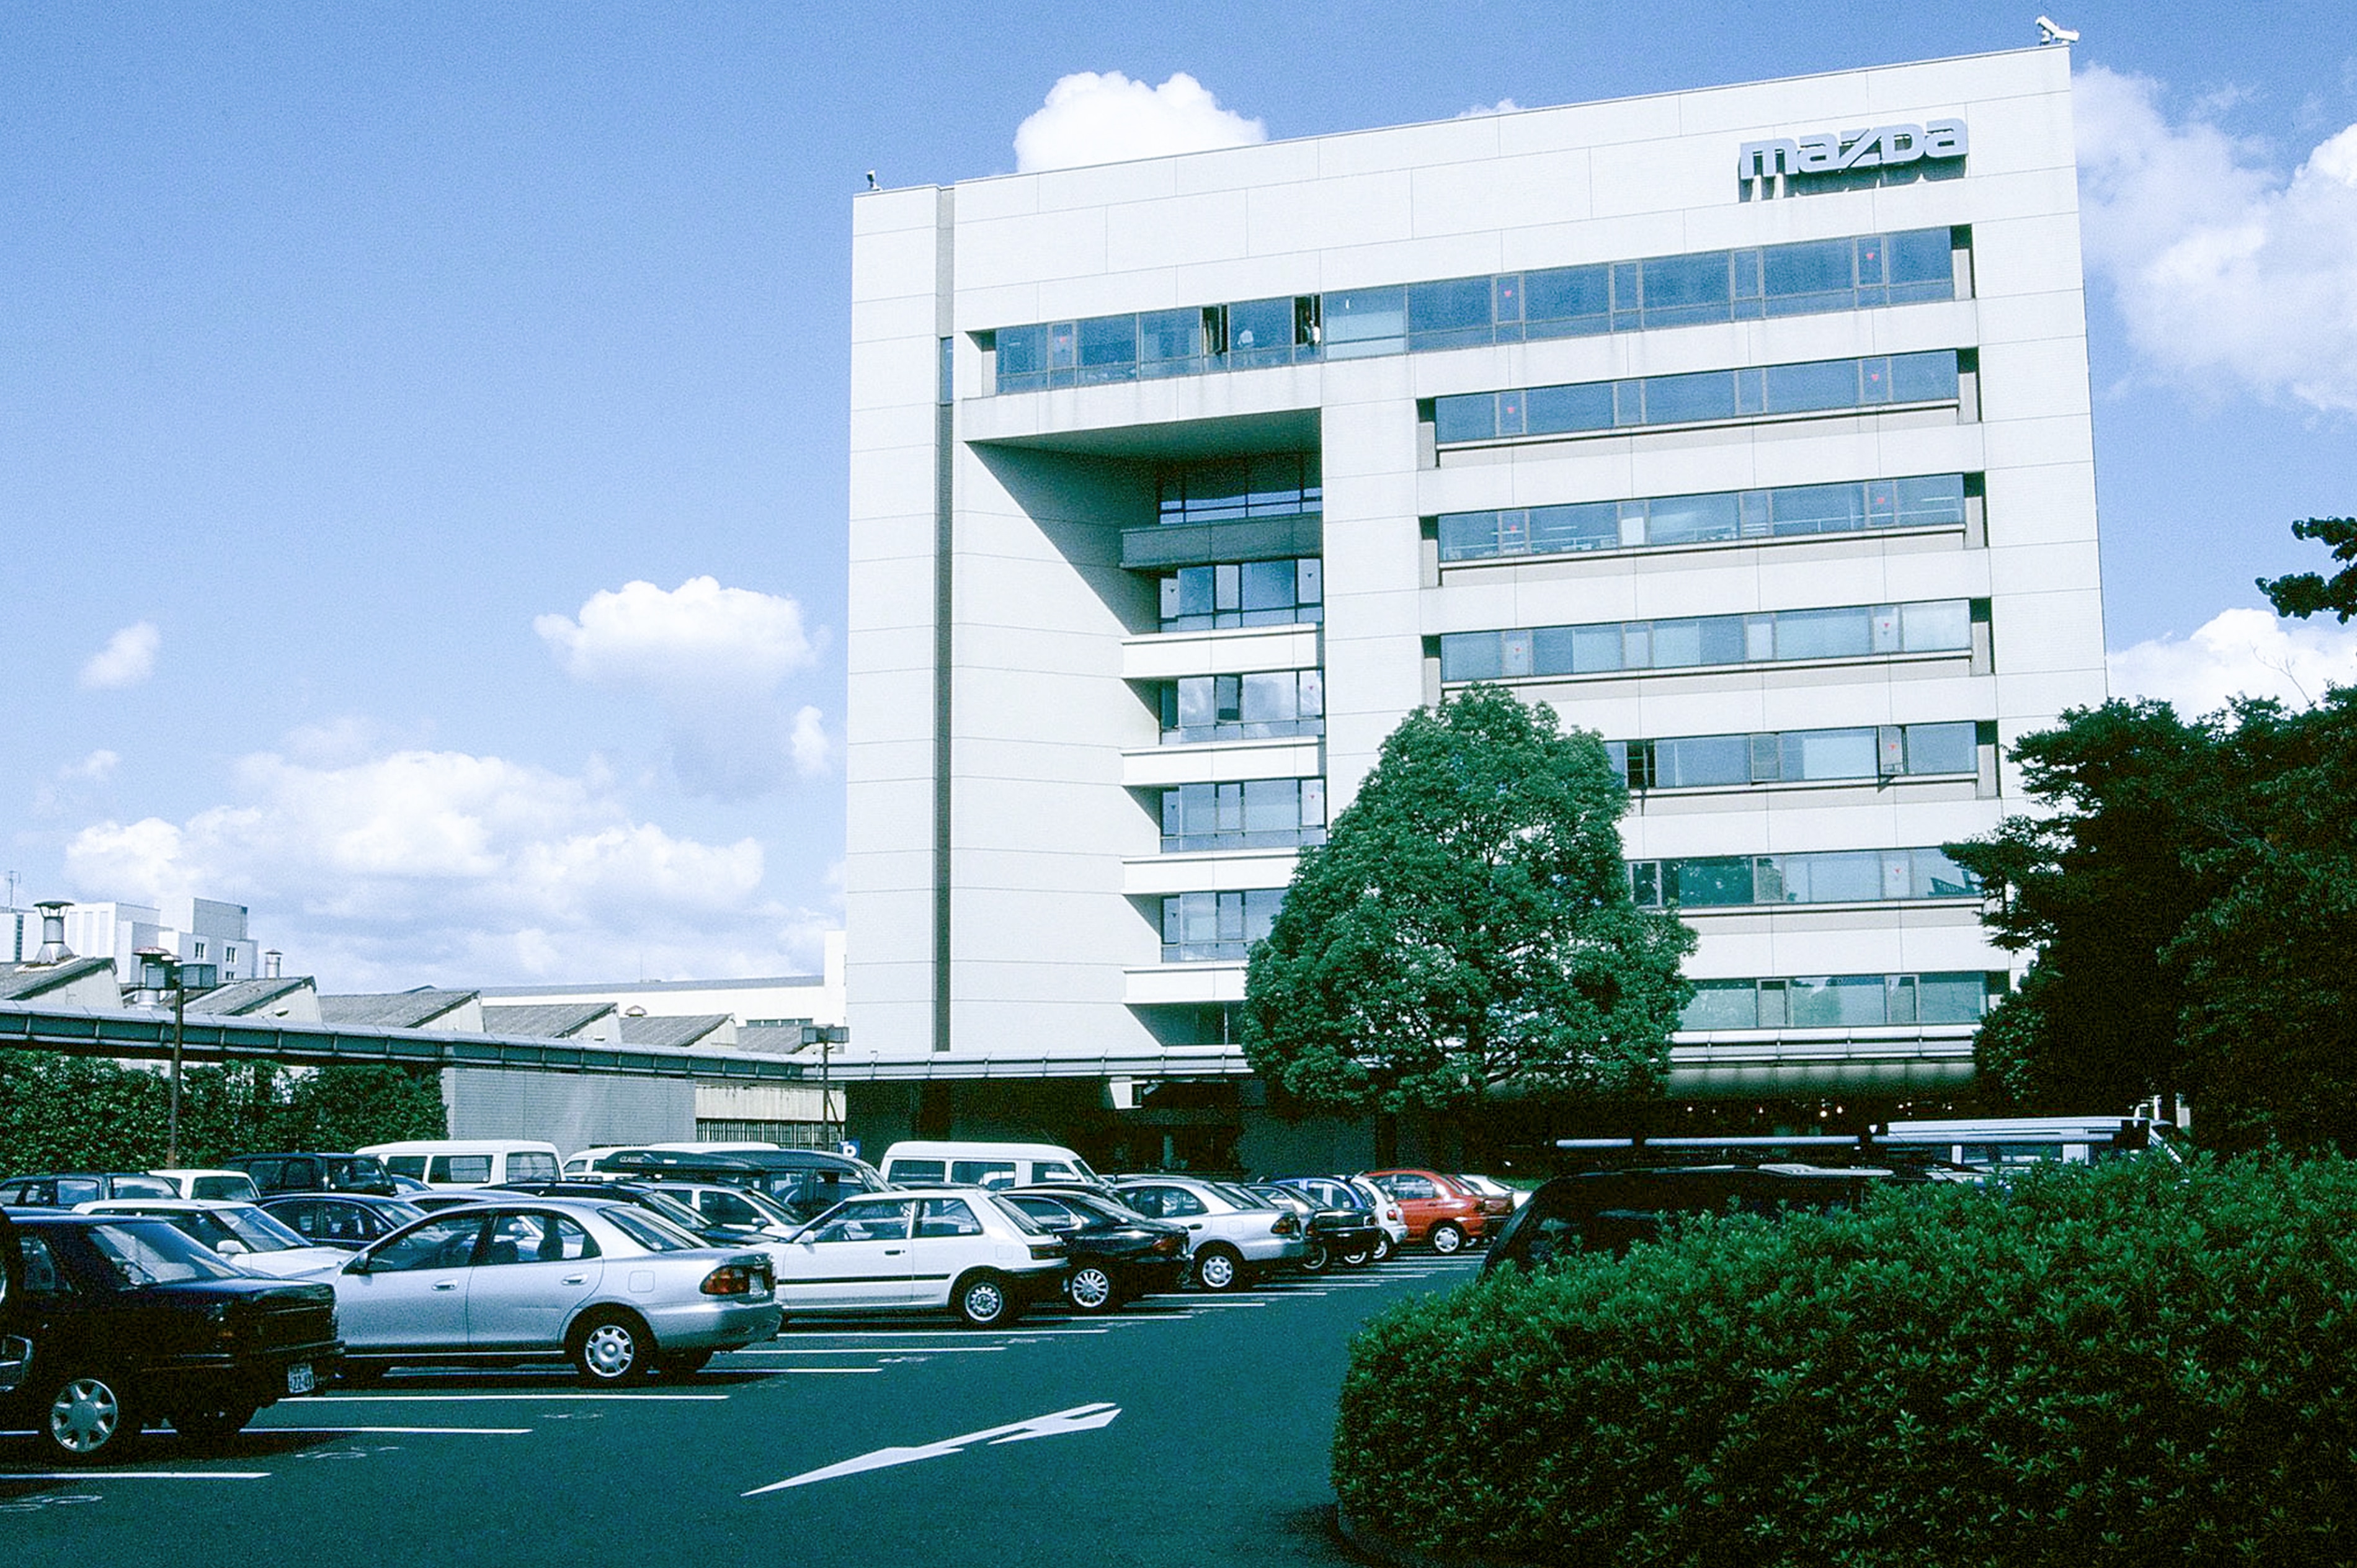
Highlights of this case
- Mazda Motor Corporation introduced the KEYENCE 3D Laser Snapshot Sensor LJ-S8000 Series in the department responsible for fuel economy and exhaust gas, to evaluate road surface unevenness as a factor in running resistance.
- Conventional measurement was centered on the line (profile); capturing an area required moving either the sensor or the object, which tended to become a large-scale arrangement. A single stone on the road could pull a line-based analysis value off.
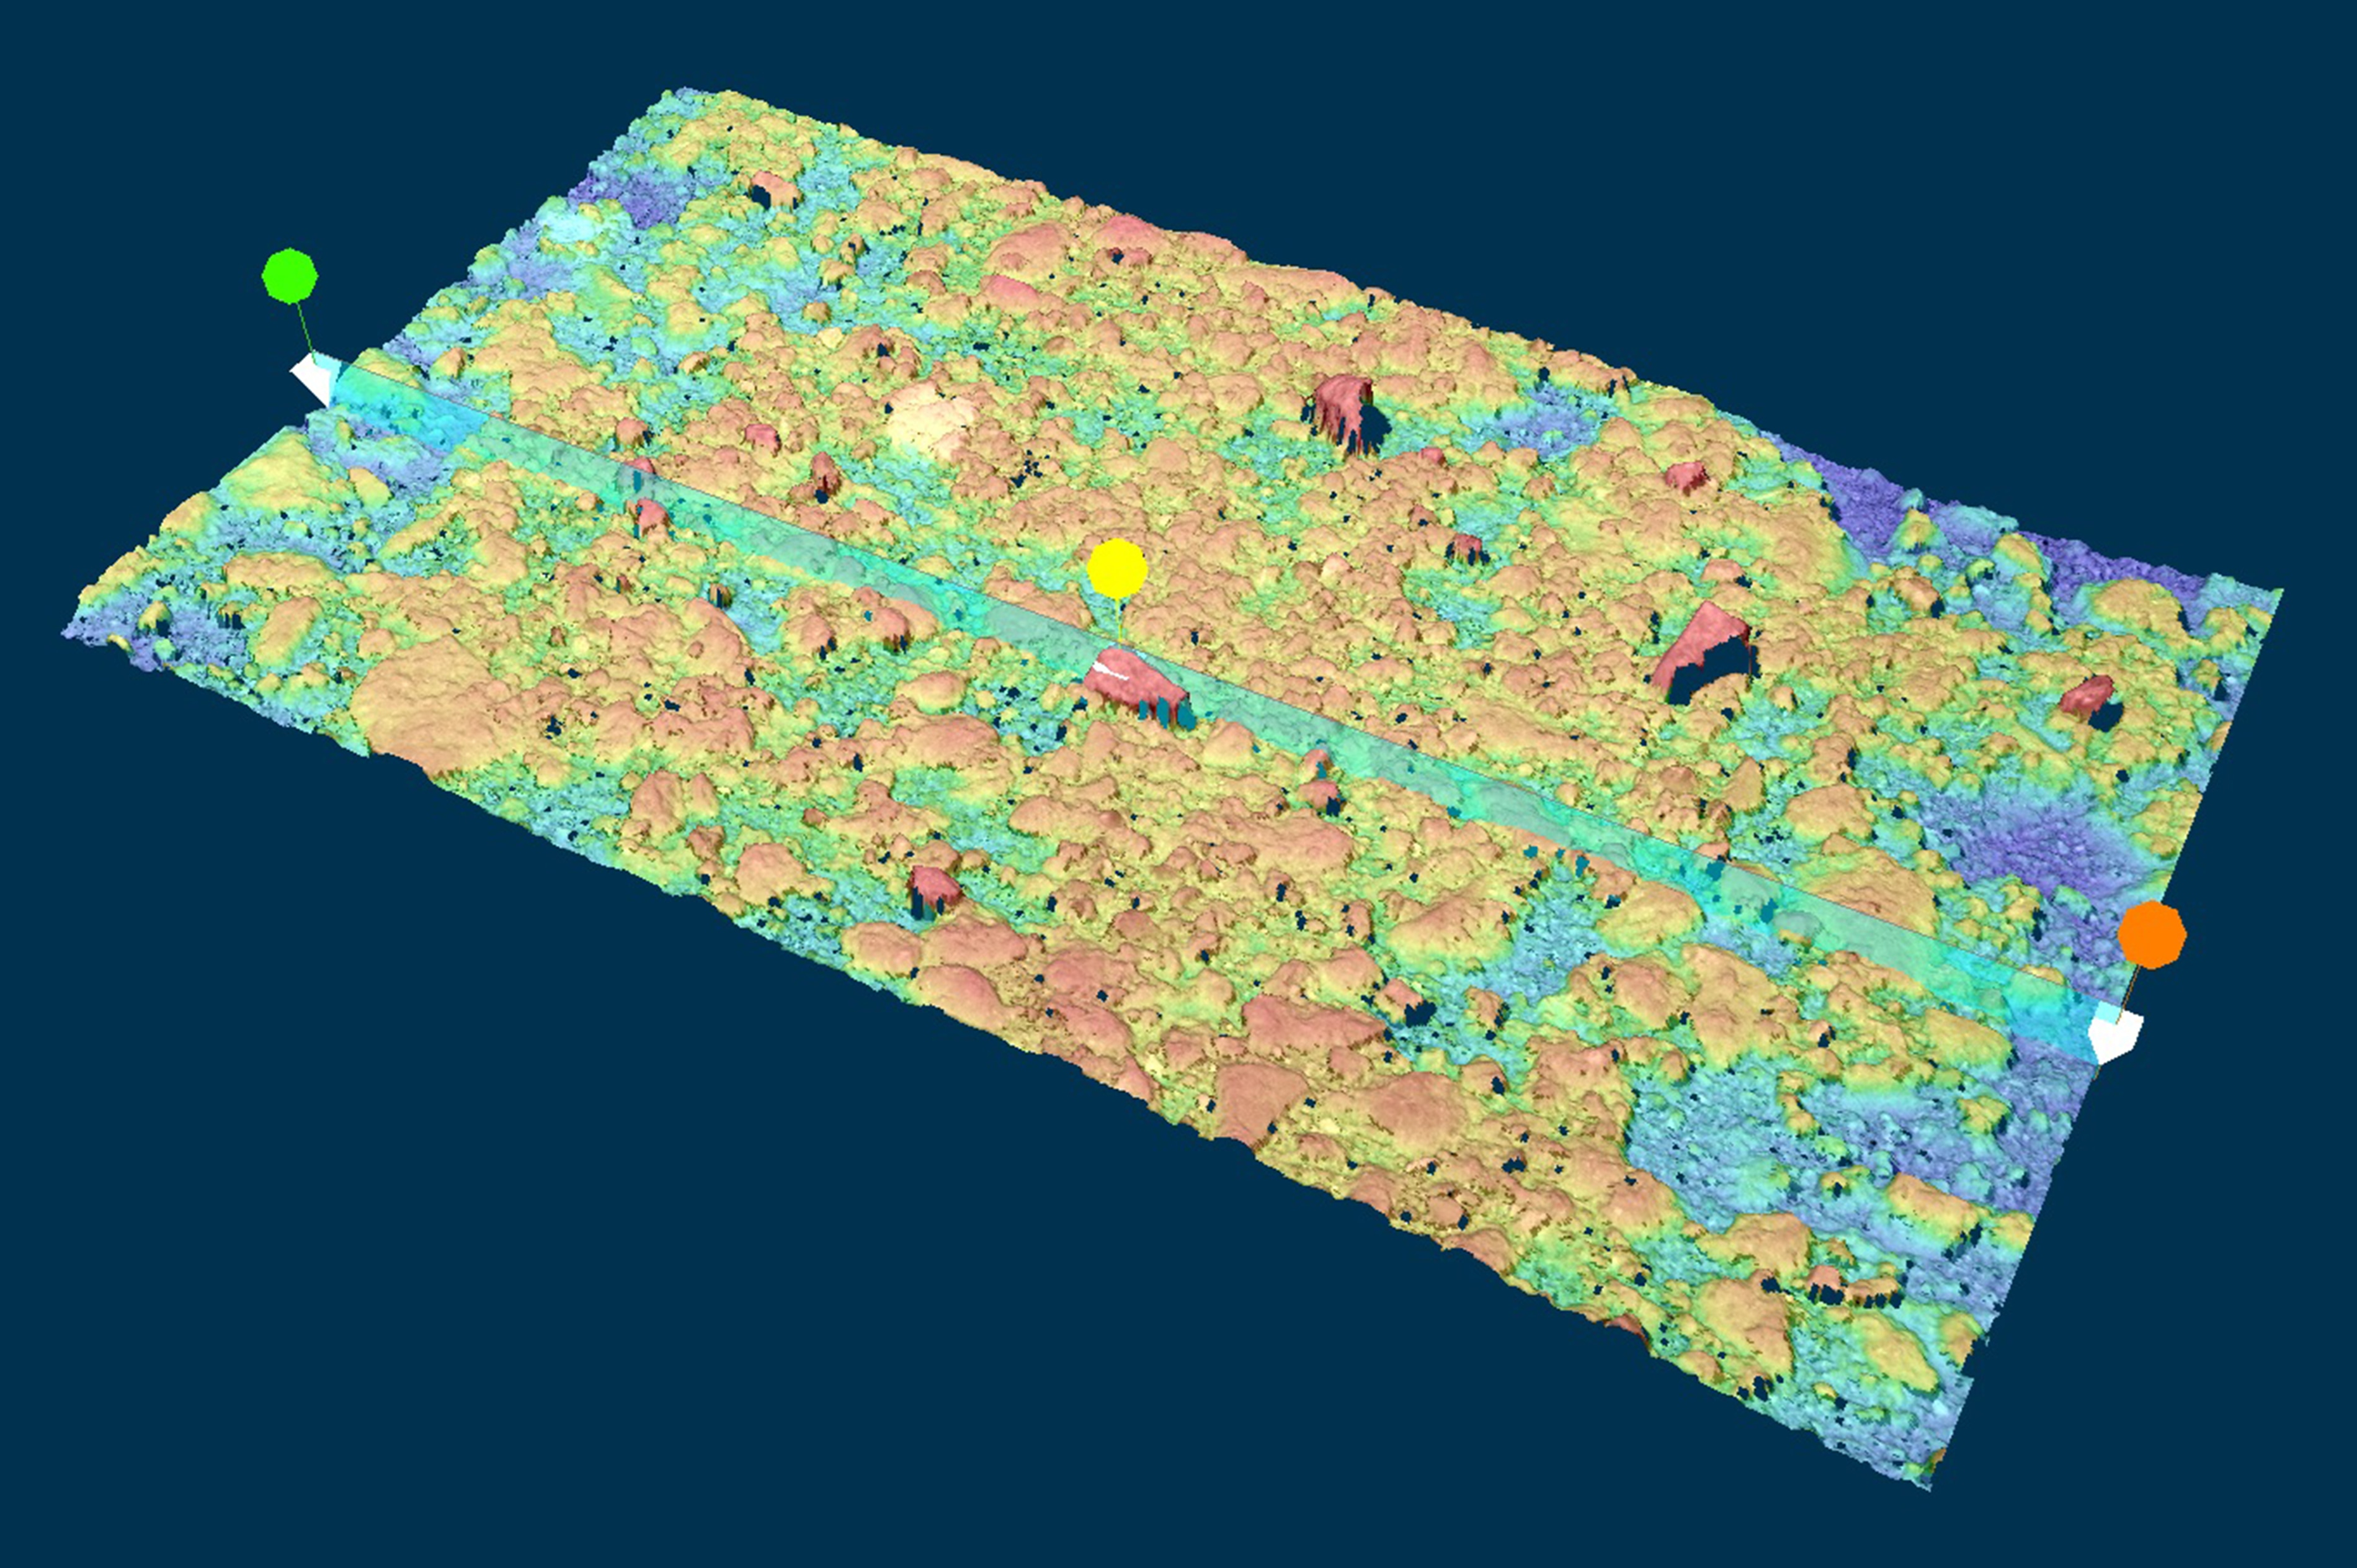
- Capturing an area made section indicators — such as peak-to-peak averages and root-mean-square values — more stable, and made the relationship with running resistance easier to organize.
- Before introduction, measurement was outsourced: coordinating the measurement company and test course availability could mean a lead time of about one month, and occupancy limits forced the team to cut measurement points.
- Today the team measures a straight section of about 1,400 m one way at 100 m intervals — 90 measurements for the round trip, in roughly two to three hours — and shares the data with the handling stability and brake groups.
ChallengeWhy the condition of the road surface had to be pinned down
The interviewee belongs to the department responsible for managing fuel economy and exhaust gas. Both are measured by running the vehicle on a chassis dynamometer — an indoor test system — under the same resistance as real driving conditions. Managing "running resistance" is therefore essential, and analyzing it and proposing improvements is the core of the job.
Running resistance, however, is difficult to break down when it is viewed only at whole-vehicle level. That created the need to grasp road surface unevenness, one of its factors, at a much higher density.
"With running resistance, when you look at the vehicle as a whole and variation appears, it is hard to separate whether it comes from the tire, the road surface or another component."
Measurement had been outsourced, and the bottleneck was scheduling. Balancing the availability of the measurement company against the availability of the test course — occupancy had to be arranged — meant a lead time that could reach about one month. When people enter the course to take measurements, occupancy is required for safety reasons, and since long occupancy slots are hard to secure, the number of measurement points inevitably had to be cut.
SelectionWhat made the LJ-S8000 Series the right choice
The starting point was simple: a tire contacts the road over an area, not a point, so the road should ideally be seen as an area too. Conventional methods, though, were centered on the line (profile), and capturing an area meant moving the sensor or the object — an arrangement that quickly became large-scale.
"If there is a single stone on the road, a line measurement is strongly affected and the analysis value can be pulled off. When you capture an area, the section indicators — peak-to-peak averages, root-mean-square values and so on — become more stable, and the relationship with resistance is easier to organize."
Two factors decided the adoption: being able to obtain 3D area data with the sensor head left in place, and being able to export measurement data as CSV. In a field application, whether data can be captured easily and consistently matters enormously, and confirming exactly that in a demonstration carried weight. Area data contains a large number of points and is unwieldy in raw form, but the team now reduces it to the indicators it needs using Python.
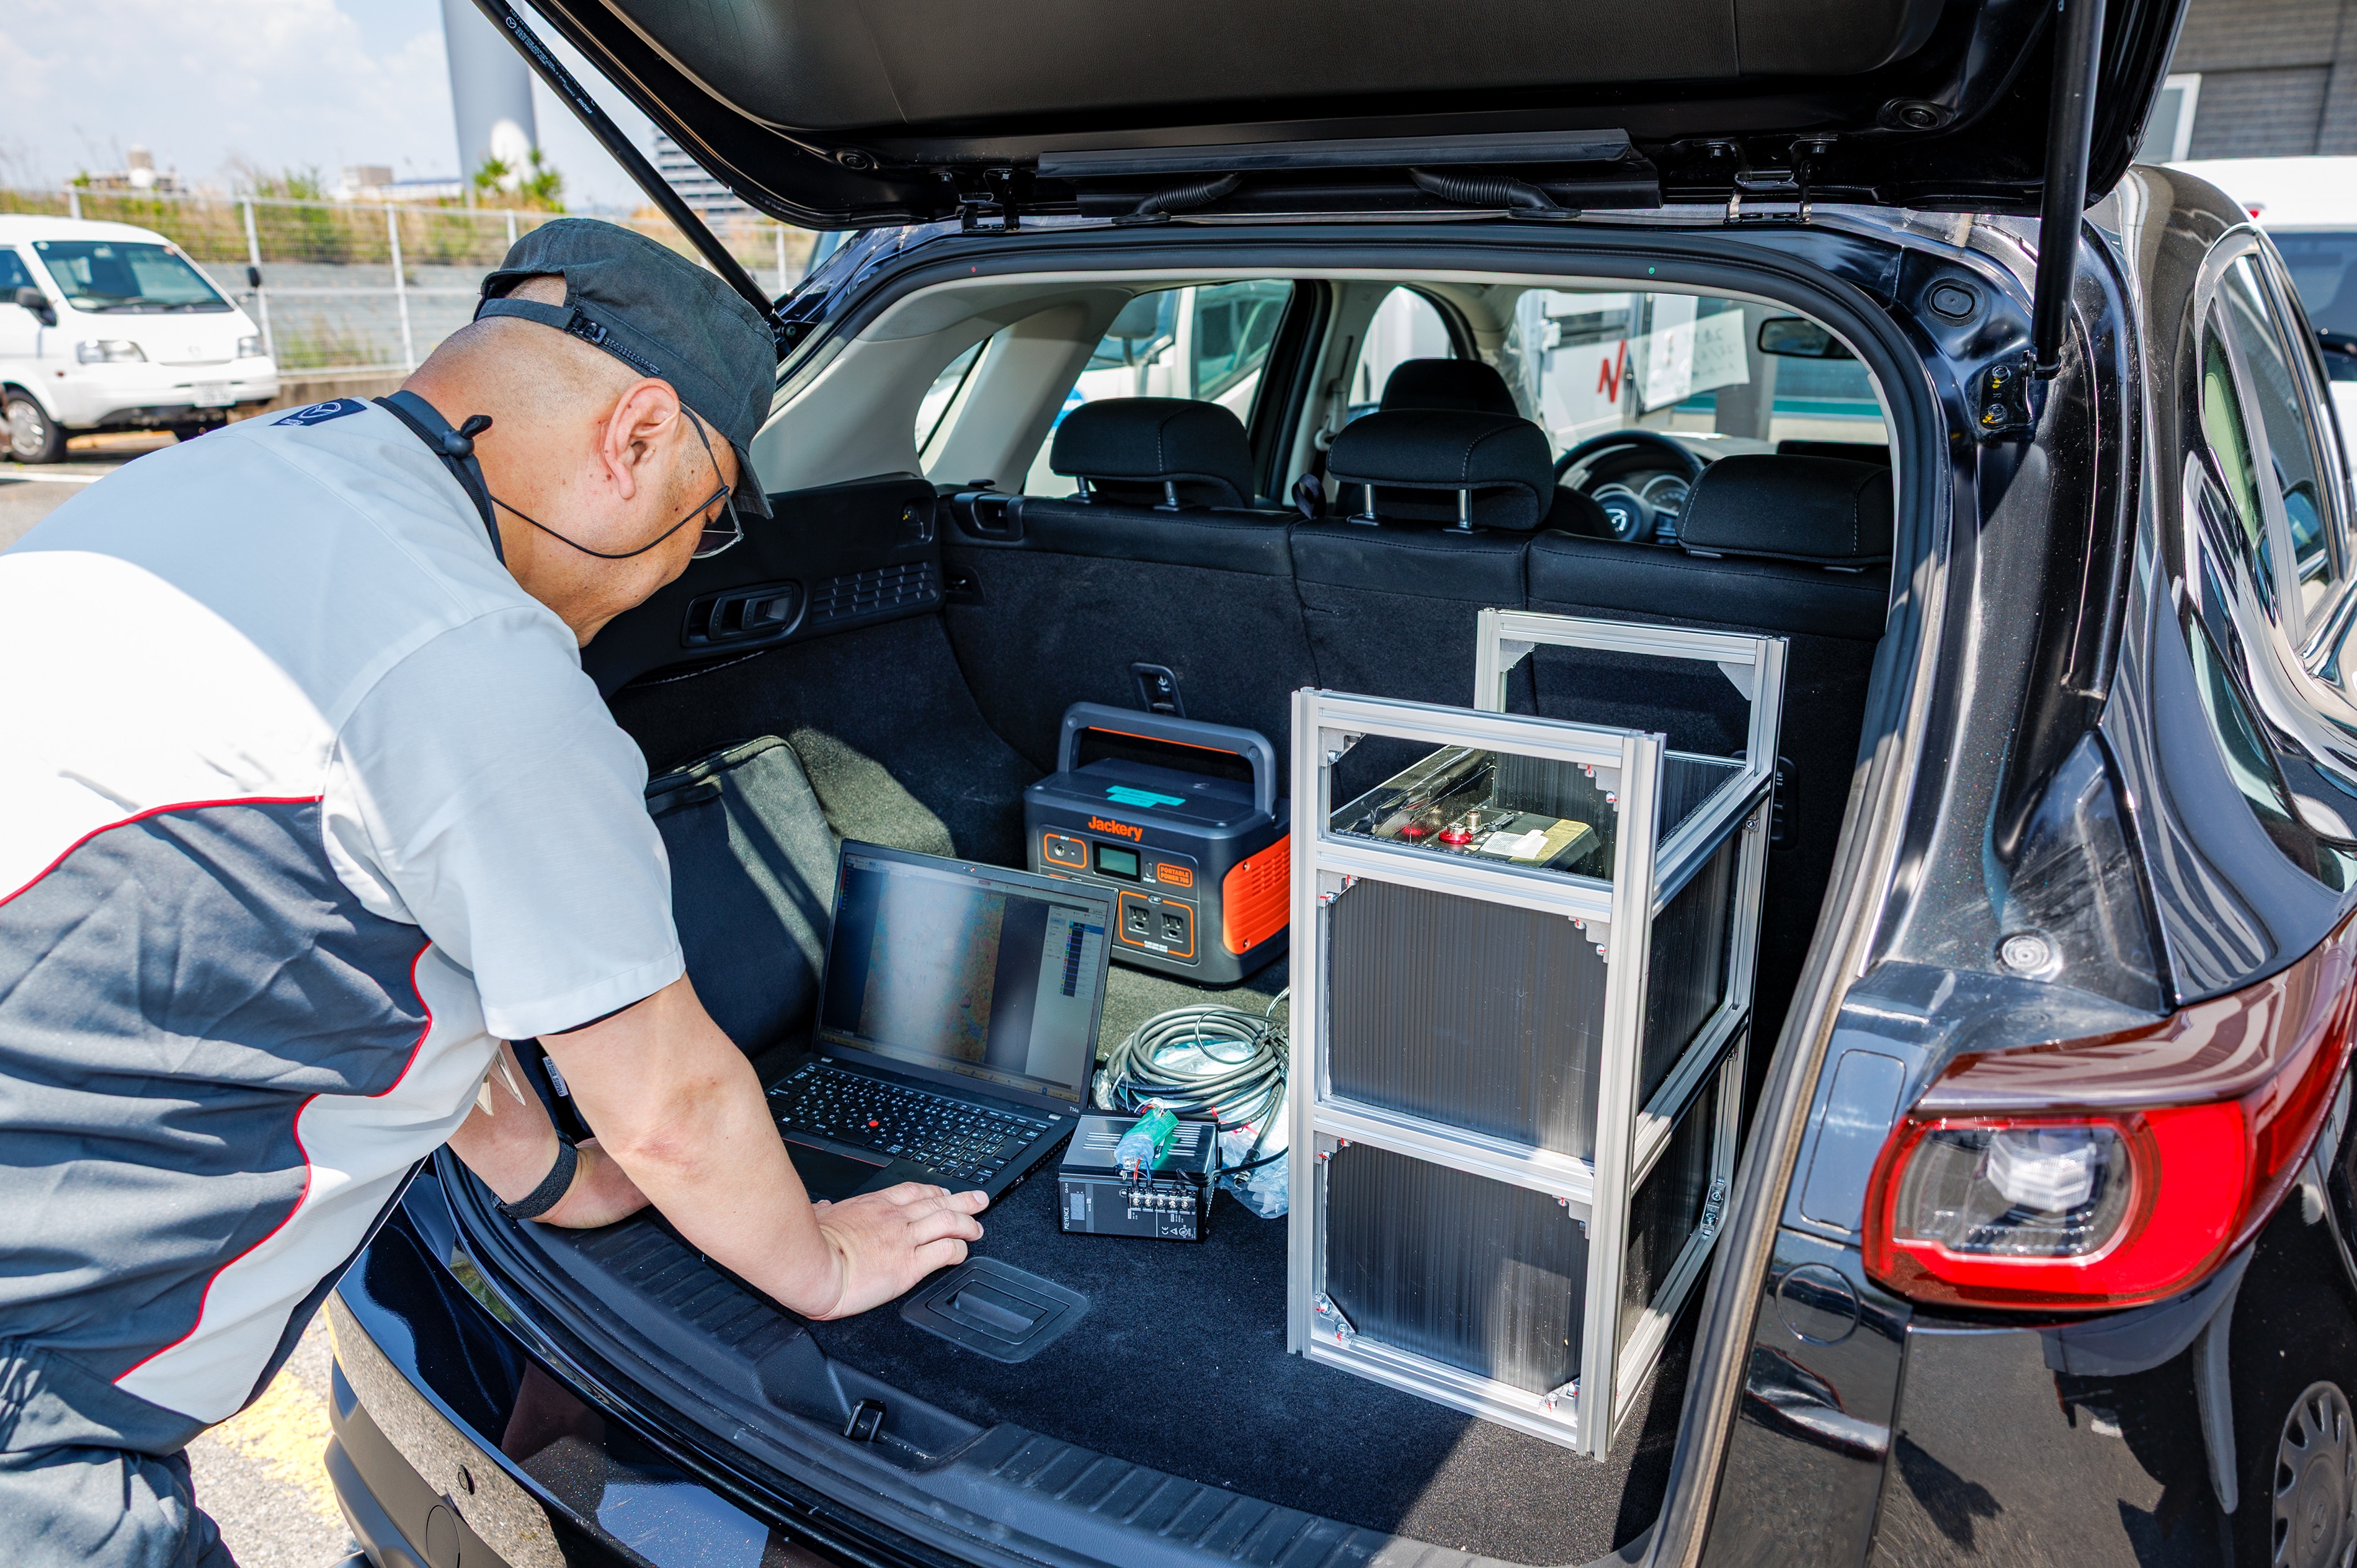
What tipped the decision was the speed of the on-site demonstration. Right after the product was first presented, the road surface on the company's own premises — the parking lot — was measured on the spot, showing that data could be captured "easily", "however many times you try" and "consistently". A simple measurement stand was brought along as well, so testing could begin without any large-scale preparation.
"With only a catalog explanation, you are left worrying that you might buy it and still not be able to use it properly. Being shown the repeatability on the actual equipment gave us the confidence that this would be fine to introduce."
ResultsWhat changed once the team could measure as much as it needed
Today the straight test section — about 1,400 m one way — is measured in both directions at 100 m intervals. That works out to 15 locations one way, with three positions taken laterally at each location: 45 measurements one way and 90 in total for the round trip. Loading the equipment into the car, driving, unloading and measuring, the whole exercise takes roughly two to three hours.
Had the same work been outsourced, occupancy constraints would have cut the number of points to around a third of that figure (from 90 down to about 30), and the result would have been line profile data rather than area data — less dependable than what the team obtains today. Being able to take measurements at the density the analysis requires translates directly into more reliable running-resistance data.
Use of the data then spread beyond the original plan. Road surface management within the running resistance group was the initial purpose, but the data acquired is now supplied to other departments as well.
"We share the data with the handling stability group and the brake group. When we told the brake team we had data from the straight section of the test course, the answer we got back was that it was more than sufficient."
OutlookWhere the road surface data goes next
With in-house road surface measurement established, the next theme is combining it with evaluation on the tire side. Customers do not use their cars under identical conditions every time, so the aim is a state in which performance stays stable however the conditions change.
"Now that we can capture road surface data, we want to combine it with tire-side evaluation so that resistance differences do not become large even when conditions differ, at home or abroad. Whatever the conditions, we want fuel economy, handling stability and braking to come out consistently."
Frequently asked questions (FAQ)
Q What does Mazda evaluate with the LJ-S8000 Series?
A
Running resistance, one of the elements behind fuel economy. When running resistance is viewed at whole-vehicle level and variation appears, it is hard to separate whether the cause is the tire, the road surface or another component. The team uses the LJ-S8000 Series to grasp road surface unevenness — one of those factors — at a higher density.
Q How was the road surface measured before the LJ-S8000 Series was introduced?
A
Measurement was outsourced. Balancing the availability of the measurement company with the availability of the test course (occupancy scheduling) meant the lead time could reach about one month. When people enter the course to measure, occupancy is required for safety reasons, and because long occupancy slots are hard to secure, the number of measurement points had to be reduced.
Q What is the benefit of measuring the road as an area rather than a line with the LJ-S8000 Series?
A
A tire contacts the road over an area, not a single point, so the road should ideally be seen as an area too. If there is a single stone on the road, a line measurement can be strongly affected and the analysis value pulled off. Capturing an area makes section indicators — such as peak-to-peak averages and root-mean-square values — more stable, and makes the relationship with resistance easier to organize.
Q What was the deciding factor in adopting the LJ-S8000 Series?
A
Being able to obtain 3D area data with the sensor head left in place was the single biggest factor. Because the device is used in the field, whether data can be captured easily and consistently was important, and confirming that in a demonstration counted for a lot. The ability to export measurement data as CSV for analysis was also cited as a reason for adoption.
Q How many measurement points does the team take with the LJ-S8000 Series?
A
The straight test section is about 1,400 m one way, and the team measures it in both directions at 100 m intervals. That is 15 locations one way, with three positions taken laterally at each location, giving 45 measurements one way and 90 in total for the round trip. Loading the equipment into the car, moving, unloading and measuring took roughly two to three hours in total.
Q Is the data captured with the LJ-S8000 Series used by departments other than running resistance?
A
Originally the main purpose was road surface management within the running resistance group, but the data acquired is now provided to other departments as well. It is shared with the handling stability group, which evaluates vehicle response when the steering wheel is turned, and with the brake group — where the response to the test course straight-line data was that it was more than sufficient.