Ra Surface Roughness vs. Sa: Comparing 2D Roughness Parameters with Their 3D Counterparts
Key Takeaways
- Ra averages height deviations along a single line, while Sa averages them across an entire area, so the same part can report different values under each.
- Most common 2D parameters have a 3D counterpart with a nearly identical name: Ra and Sa, Rq and Sq, Rz and Sz, Rsk and Ssk, Rku and Sku.
- Matching names do not mean matching values. Different sampling, filtering, and definitions mean 2D and 3D results cannot be converted with a simple factor.
- Ra can look identical on surfaces that behave very differently. Pairing it with distribution parameters such as skewness and kurtosis reveals what an average hides.
- Moving a drawing from Ra to Sa requires new tolerance limits validated on the actual part, not a one-for-one swap.
Ra is the most widely used number in manufacturing for describing how rough a surface is. It appears on drawings, in supplier contracts, and on inspection reports, and for many parts it is all that is needed. But Ra is one of many roughness parameters, and it is calculated from a profile, which is a single line traced across the part.
As areal measurement becomes more common, each familiar profile parameter now has a three-dimensional counterpart, often named with a single letter changed. This article compares the main 2D parameters with their 3D equivalents (Ra vs. Sa, Rq vs. Sq, Rz vs. Sz, and Rsk/Rku vs. Ssk/Sku) and explains why similar names do not guarantee similar numbers.
What Ra Surface Roughness Tells You
Ra, the arithmetic mean roughness, is the average of the absolute height deviations of a profile from its mean line over the evaluation length:
Ra = (1/L) ∫ |z(x)| dx
In plain terms, every deviation from the mean line is counted as a positive number, whether it is a peak or a valley, and then averaged. Results are typically reported in micrometers or microinches.
Ra has stayed dominant for good reasons. It is simple, stylus instruments are inexpensive, and decades of drawings, supplier agreements, and historical data are built around it. For uniform, consistently machined surfaces, it is often sufficient.
Its weakness is the averaging itself. A deep scratch barely moves the average, and a surface dominated by sharp peaks can produce the same Ra as one with flat plateaus and narrow valleys, even though they would seal, wear, and hold lubricant very differently. Because Ra comes from one line, the result also depends on where and in which direction the trace was taken relative to the surface's lay.
Surface Roughness Parameters: 2D and 3D Counterparts at a GlanceSurface Roughness Parameters: 2D and 3D Counterparts at a Glance
2D profile parameters are defined in the ISO 21920 series, which replaces ISO 4287 and ISO 4288. 3D areal parameters are defined in ISO 25178. The table below pairs the most common 2D parameters with their areal counterparts.
| What it describes | 2D profile | 3D areal | Most sensitive to |
|---|---|---|---|
|
Average height deviation
|
2D profile
Ra
|
3D areal
Sa
|
Most sensitive to
Overall texture level
|
|
Root mean square height
|
2D profile
Rq
|
3D areal
Sq
|
Most sensitive to
Outlying peaks and valleys
|
|
Maximum height (peak to valley)
|
2D profile
Rz
|
3D areal
Sz
|
Most sensitive to
Single extreme peaks or pits
|
|
Asymmetry of height distribution
|
2D profile
Rsk
|
3D areal
Ssk
|
Most sensitive to
Peak- vs. valley-dominated texture
|
|
Sharpness of height distribution
|
2D profile
Rku
|
3D areal
Sku
|
Most sensitive to
Spiky vs. uniform texture
|
The 2D versions are calculated from a single line over the evaluation length. The 3D versions are calculated from every point in the measured area. These five pairs are not the full set of surface roughness measurement parameters: ISO 25178 also defines areal-only functional, spatial, and hybrid parameters with no profile equivalent. Those are covered in our guide to 3D surface texture analysis.
Ra vs. Sa Surface Roughness
Sa surface roughness is the same concept as Ra applied to an entire area: the arithmetic mean of the absolute height deviations across the measured field.
Sa = (1/A) ∬ |z(x,y)| dx dy
Because Sa draws on every point in the area, it is less sensitive to where the measurement was taken. A single Ra trace can change noticeably with its position or direction, while Sa averages over the full field. On uniform surfaces, the two values often land close together. On directional, patterned, or locally damaged surfaces, they can diverge in either direction, depending on whether the line happened to cross or miss the feature.
One caution: Sa is still an average. A single isolated defect may not move it much. The real advantage of areal data is the topography map and the additional parameters that come with it, not Sa on its own.
Rq vs. Sq
Rq and Sq are the root mean square equivalents of Ra and Sa. Because deviations are squared before averaging, large peaks and valleys carry more weight. Rq is always greater than or equal to Ra, and Sq is always greater than or equal to Sa.
For a surface with a roughly Gaussian height distribution, the ratio Rq/Ra is about 1.25. A ratio well above that suggests outlying peaks or pits that Ra is smoothing over, so comparing the two is a quick screening check. Rq surface roughness is commonly specified for smooth, optical, and precision surfaces, where isolated features matter more.
Rz vs. Sz
Rz describes peak-to-valley height: the distance between the highest peak and the deepest valley in the evaluated profile. Sz applies the same idea across the full measured area. A caution on definitions: Rz is evaluated per sampling length and is sometimes averaged across several, and legacy conventions differ, so confirm which definition your drawing or standard calls out before comparing numbers.
Sz is an extreme value over the whole area and is not averaged, so one spike or pit anywhere in the field sets it. As a result, Sz is typically larger than an Rz taken on the same surface, and it is more sensitive to dust, scratches, and measurement noise. If you use Sz or any other Rz surface roughness comparison, check how outliers and filtering are handled.
Skewness and Kurtosis: Rsk/Ssk and Rku/Sku
These parameters describe the shape of the height distribution, which Ra and Sa cannot.
- Skewness (Rsk, Ssk) shows whether a surface is dominated by peaks or valleys. A negative value indicates valley-dominated texture, such as a plateau-honed finish that retains lubricant. A positive value indicates sharp peaks that wear quickly or concentrate contact.
- Kurtosis (Rku, Sku) shows how sharp the distribution is. A value near 3 indicates a random, bell-shaped distribution. Higher values point to sharp spikes or deep narrow pits, and lower values to a more uniform, bumpy texture.
Two surfaces with the same Ra or Sa can have opposite skewness, which is often the explanation when parts that meet the same roughness spec perform differently. The areal versions use the full area, so they do not depend on trace position.
Why Matching Names Do Not Mean Matching Values
It is tempting to treat Sa as "Ra, but 3D." Four differences make that unsafe:
- Sampling: a line versus an area. They can capture different features, so the values can differ even on the same part.
- Filtering: profile roughness is separated from waviness using cutoff wavelengths, while areal data uses S-filters and L-filters defined in ISO 25178. Changing filter settings changes the result, so settings should always be reported with the value.
- Direction: a profile result depends on trace direction relative to the lay. Areal parameters include all directions.
- Definitions: as with Rz and Sz, parameters that look equivalent are not always calculated identically.
There is no universal conversion factor between 2D and 3D values. Sa is not Ra multiplied by a constant, and tolerances written for one cannot be copied to the other.
Choosing Between 2D and 3D Roughness Parameters
2D surface roughness measurement remains a good fit when the surface is uniform and consistently machined, when you are working to existing drawings and supplier requirements, and when the goal is a quick, repeatable finish check.
Areal parameters add the most value when:
- The surface has directional texture, local defects, or structured features
- Parts are coated, porous, or lack a clear machining pattern
- Measured values change depending on where the trace was taken
- Parts meet the Ra spec but still show wear, sealing, or adhesion problems
For a deeper look at when it makes sense to switch, see our overview of 3D surface roughness measurement.
If the limits of your current instruments are the concern, see why your current surface measurement tools may not give you the full picture.
Moving a Specification from Ra to Sa
Because the values cannot be converted, a transition works best as a staged process:
-
1.Measure both ways. Keep the Ra callout in place while collecting Sa on the same parts. Many optical profilers can extract a line profile from 3D data, which makes side-by-side comparison practical.
-
2.Establish new limits. Set Sa tolerances from parts known to perform well and parts known to fail, rather than from Ra limits.
-
3.Validate filter settings. Confirm that filters behave appropriately on the actual surface, especially if it is directional or periodic.
-
4.Update documentation. Revise drawings and supplier requirements, since many still reference older profile standards.
Ra vs. Sa: Key Differences Between 2D and 3D Roughness Parameters
Ra is still a useful, well-understood number, but it is one line's worth of information. Sa, Sq, Sz, Ssk, and Sku extend the same familiar parameters across a full area, and they bring in shape and extreme-value information that profile averages leave out. The key is to treat them as related but distinct parameters, each with its own specification, rather than as drop-in replacements.
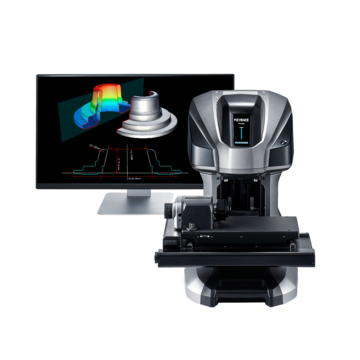
KEYENCE's 3D Optical Profiling Microscope and 3D optical profilometers capture full-area data and report ISO 25178 areal parameters, helping teams compare 2D and 3D results on the same part.
Frequently Asked Questions
Q What does Ra surface roughness mean?
A
It is the arithmetic mean of the absolute height deviations of a profile from its mean line. It summarizes how rough a surface is along one measured line, and it is the most common roughness value found on drawings.
Q What is the difference between Ra and Sa surface roughness?
A
Ra is calculated from a single profile line, while Sa is calculated from the entire measured area. Both are arithmetic means of height deviation, but Sa is less dependent on where and in what direction the measurement was taken.
Q What are the 3D equivalents of Ra, Rq, and Rz?What are the 3D equivalents of Ra, Rq, and Rz?
A
The areal equivalents are Sa for Ra, Sq for Rq, and Sz for Rz. They are defined in ISO 25178 and calculated across a full area rather than along a line.
Q Can I convert Ra to Sa?
A
No. The parameters use different sampling, filtering, and in some cases definitions, so no single factor converts one to the other. New Sa tolerances should be established and validated on the actual surface.
Q What are the most common surface roughness parameters?
A
The most common are Ra, Rq, and Rz for 2D profiles, along with skewness (Rsk) and kurtosis (Rku). Their 3D equivalents are Sa, Sq, Sz, Ssk, and Sku.
Q Is Sa better than Ra?
A
Not always. Ra is sufficient for uniform, consistently machined surfaces. Sa and other areal parameters are more useful for directional, patterned, coated, or complex surfaces where one line may not represent the part.