I want to display a graph on the touch panel.
This section explains how to display a graph on the VT5 using a trend graph part.
Trend graph part settings
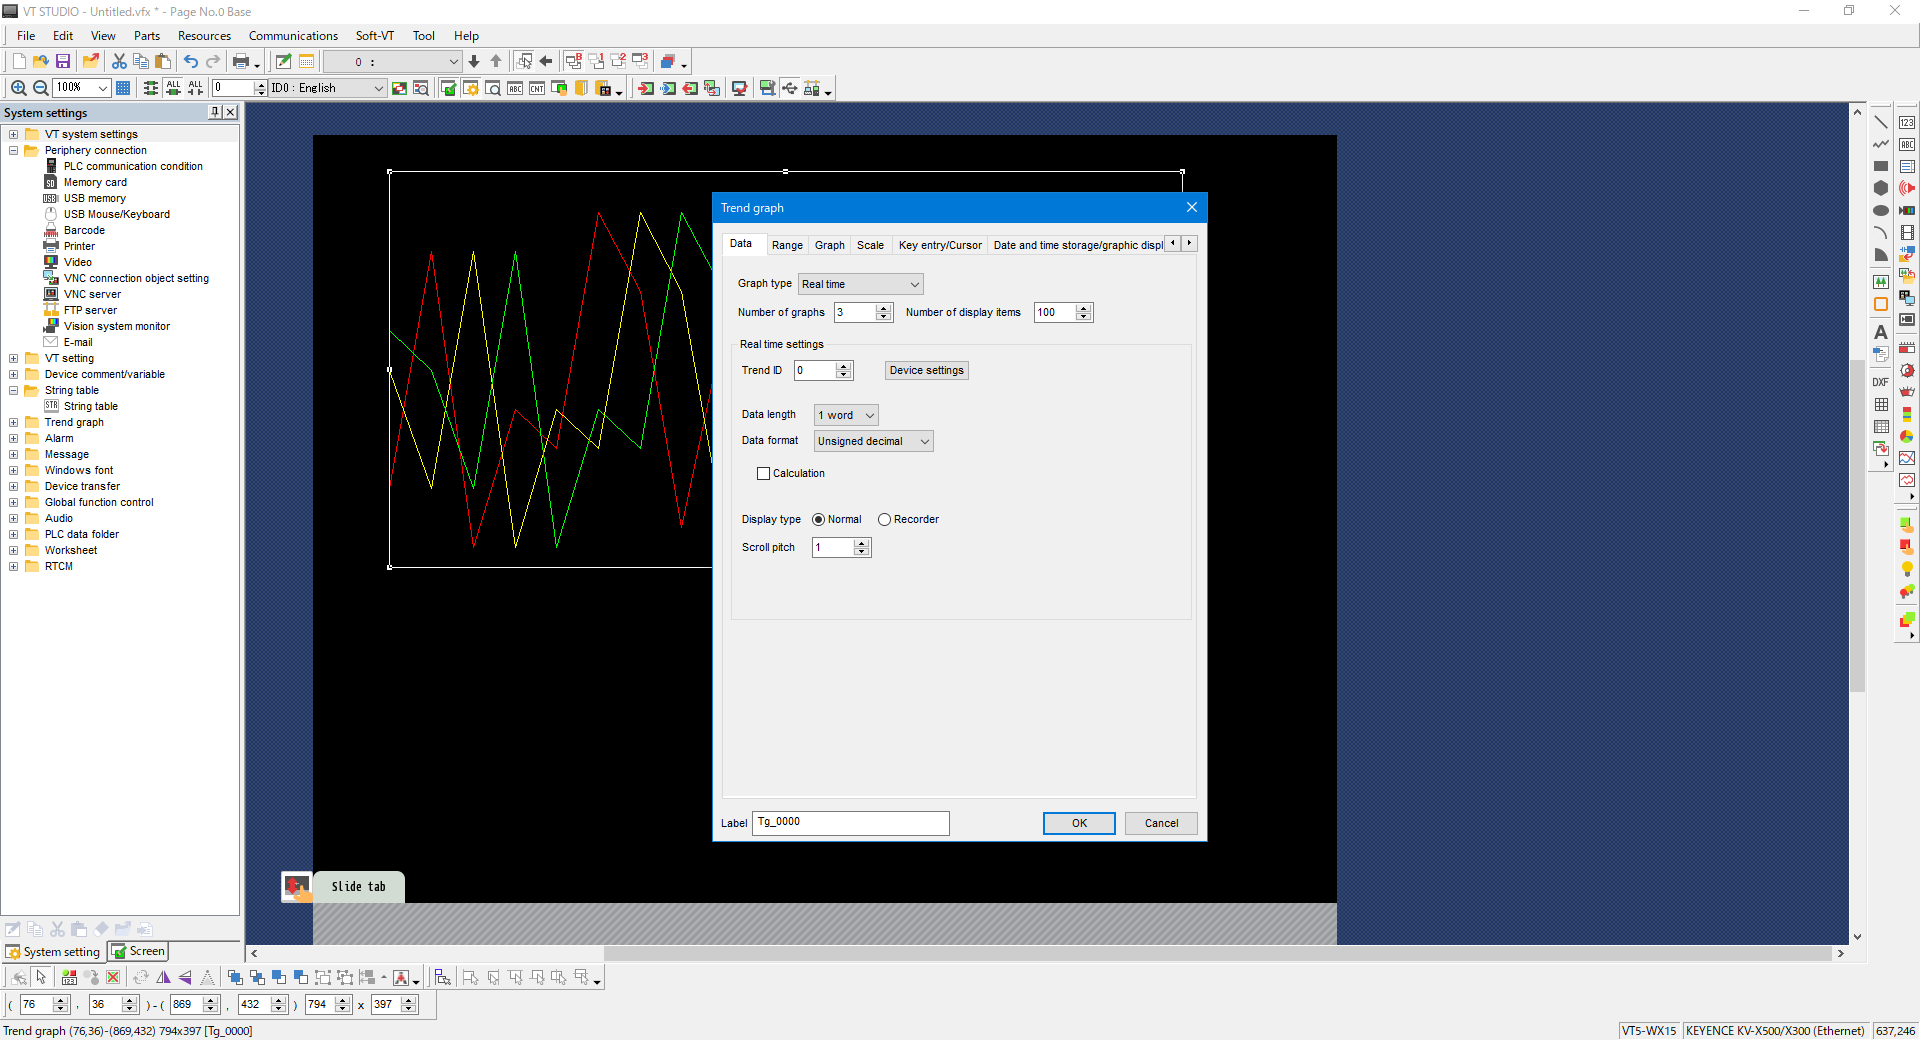
1. From the menu, select [Parts] -> [Meters/Graphs] -> [Trend graph], and then place a trend graph part.

2. On the “Data” tab, set the number of graph lines, the amount of data to display on the graph, and the data format. The graph types are as follows.
| Item | Setting | Description |
|---|---|---|
| Graph type | Real time | The graph is updated in real time with device values acquired each time the set trigger occurs. |
| Batch sampling | The graph is updated with the data of continuous devices acquired as a batch when the trigger occurs. | |
| Worksheet | The graph is updated with the data of continuous worksheets acquired as a batch when the worksheet data is updated. |
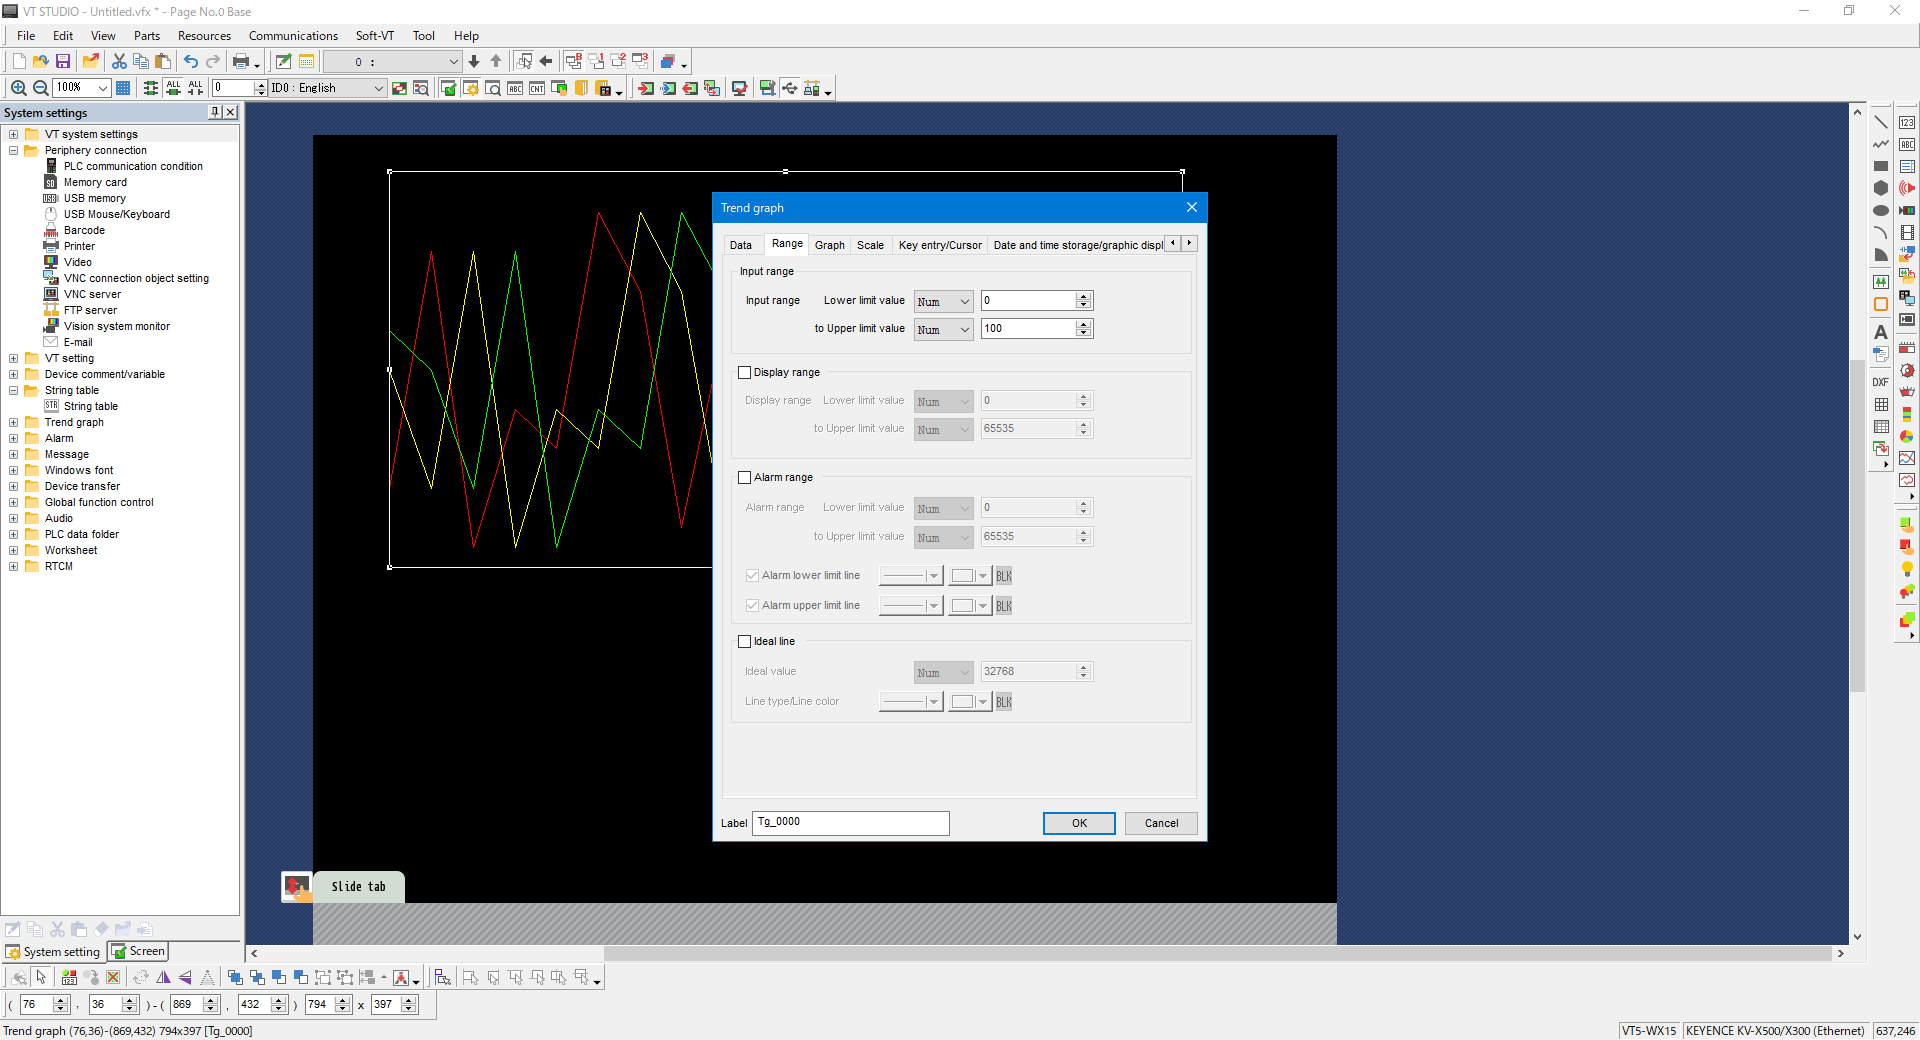
3. On the “Range” tab, set the input range to match the range of values to acquire. The example settings in the following figure are for a range of values of 0 to 100.
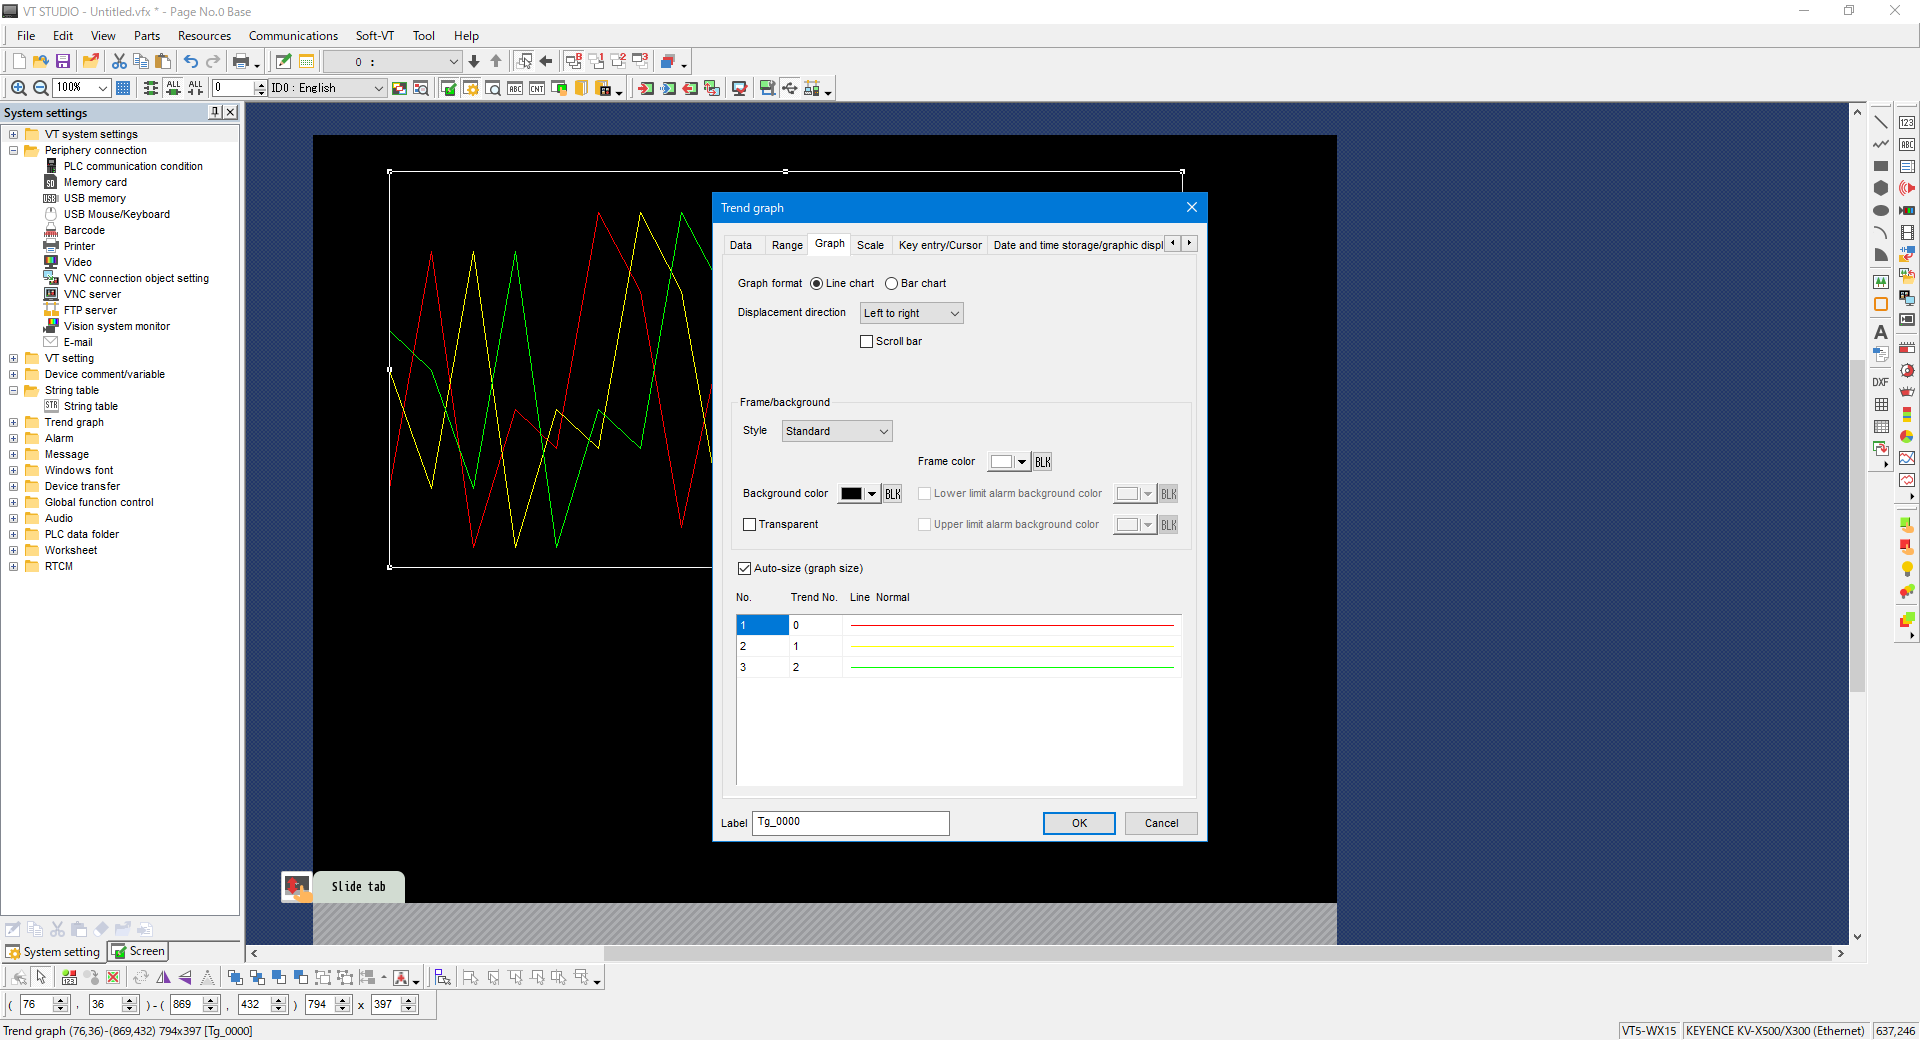
4. On the “Graph” tab, set the background color of the graph area as well as the colors and thicknesses of the graph lines.
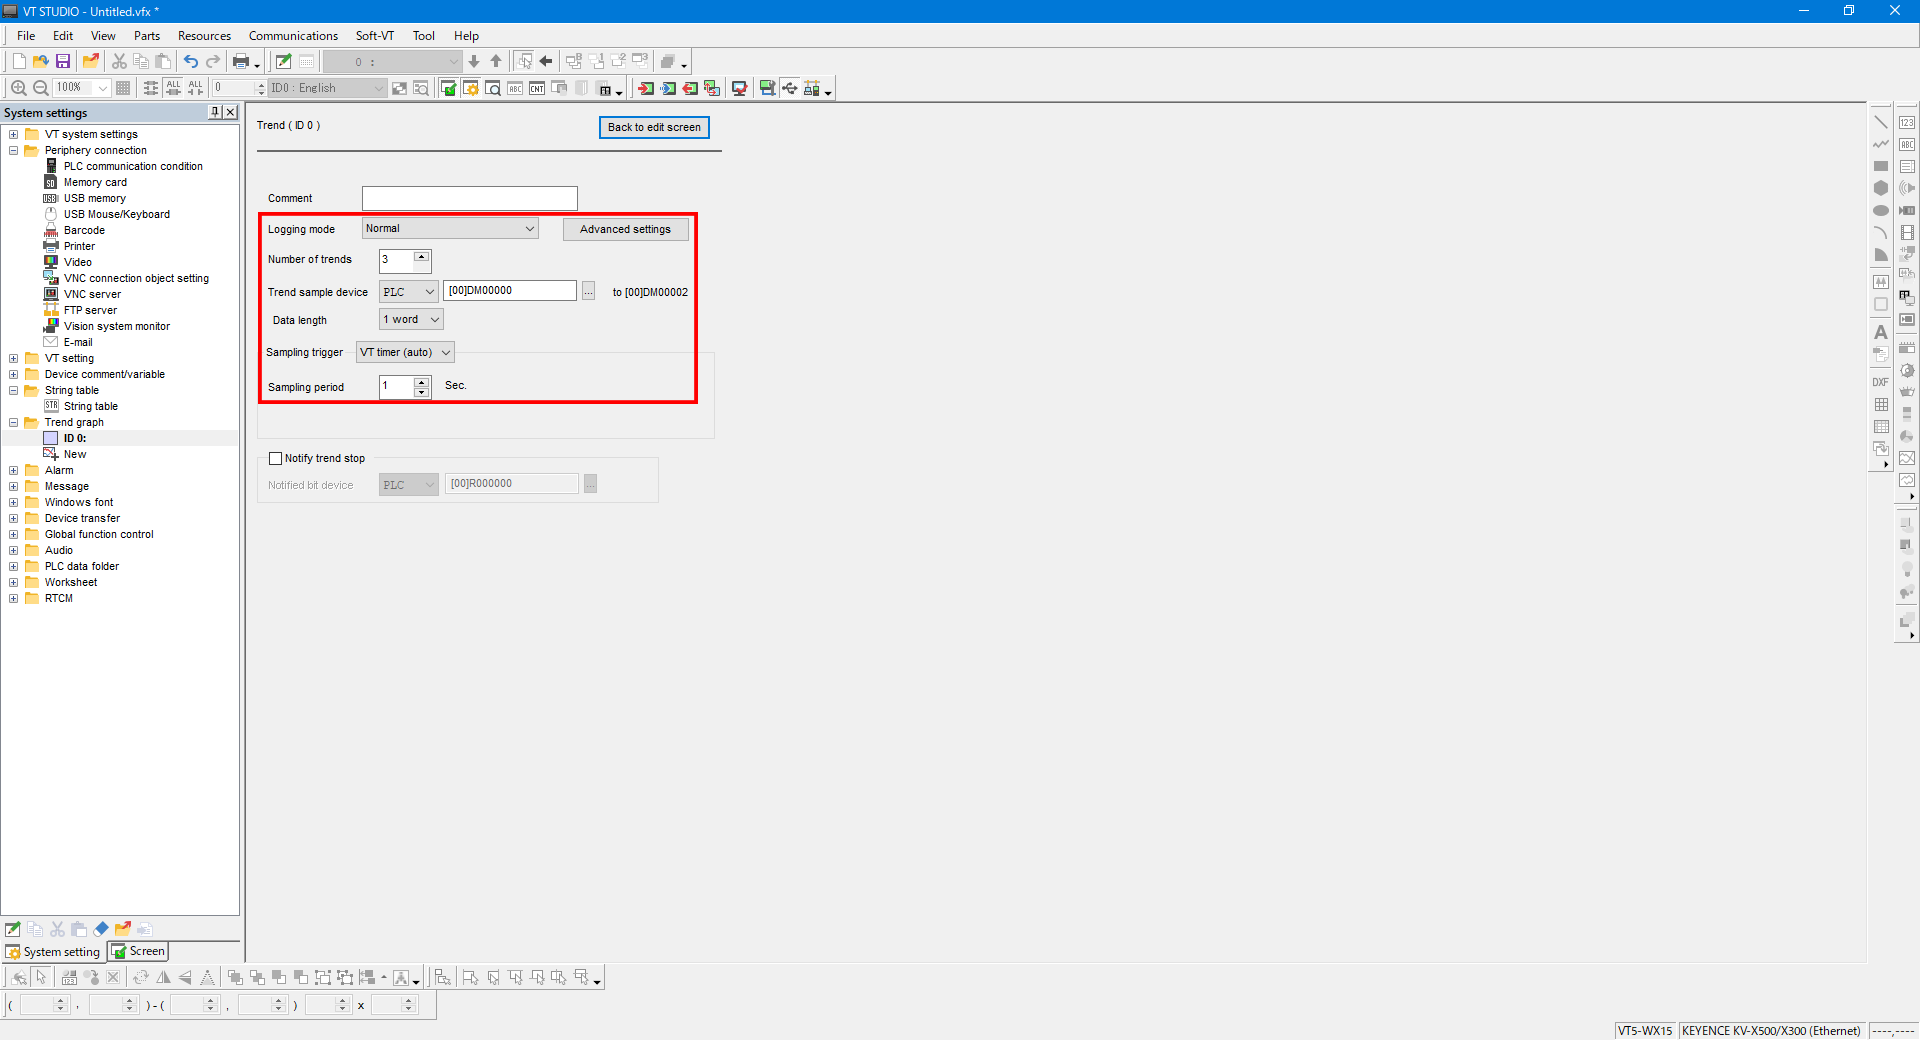
Sampling trigger/device settings
5. From the menu, select [Resources] -> [Trend graph].
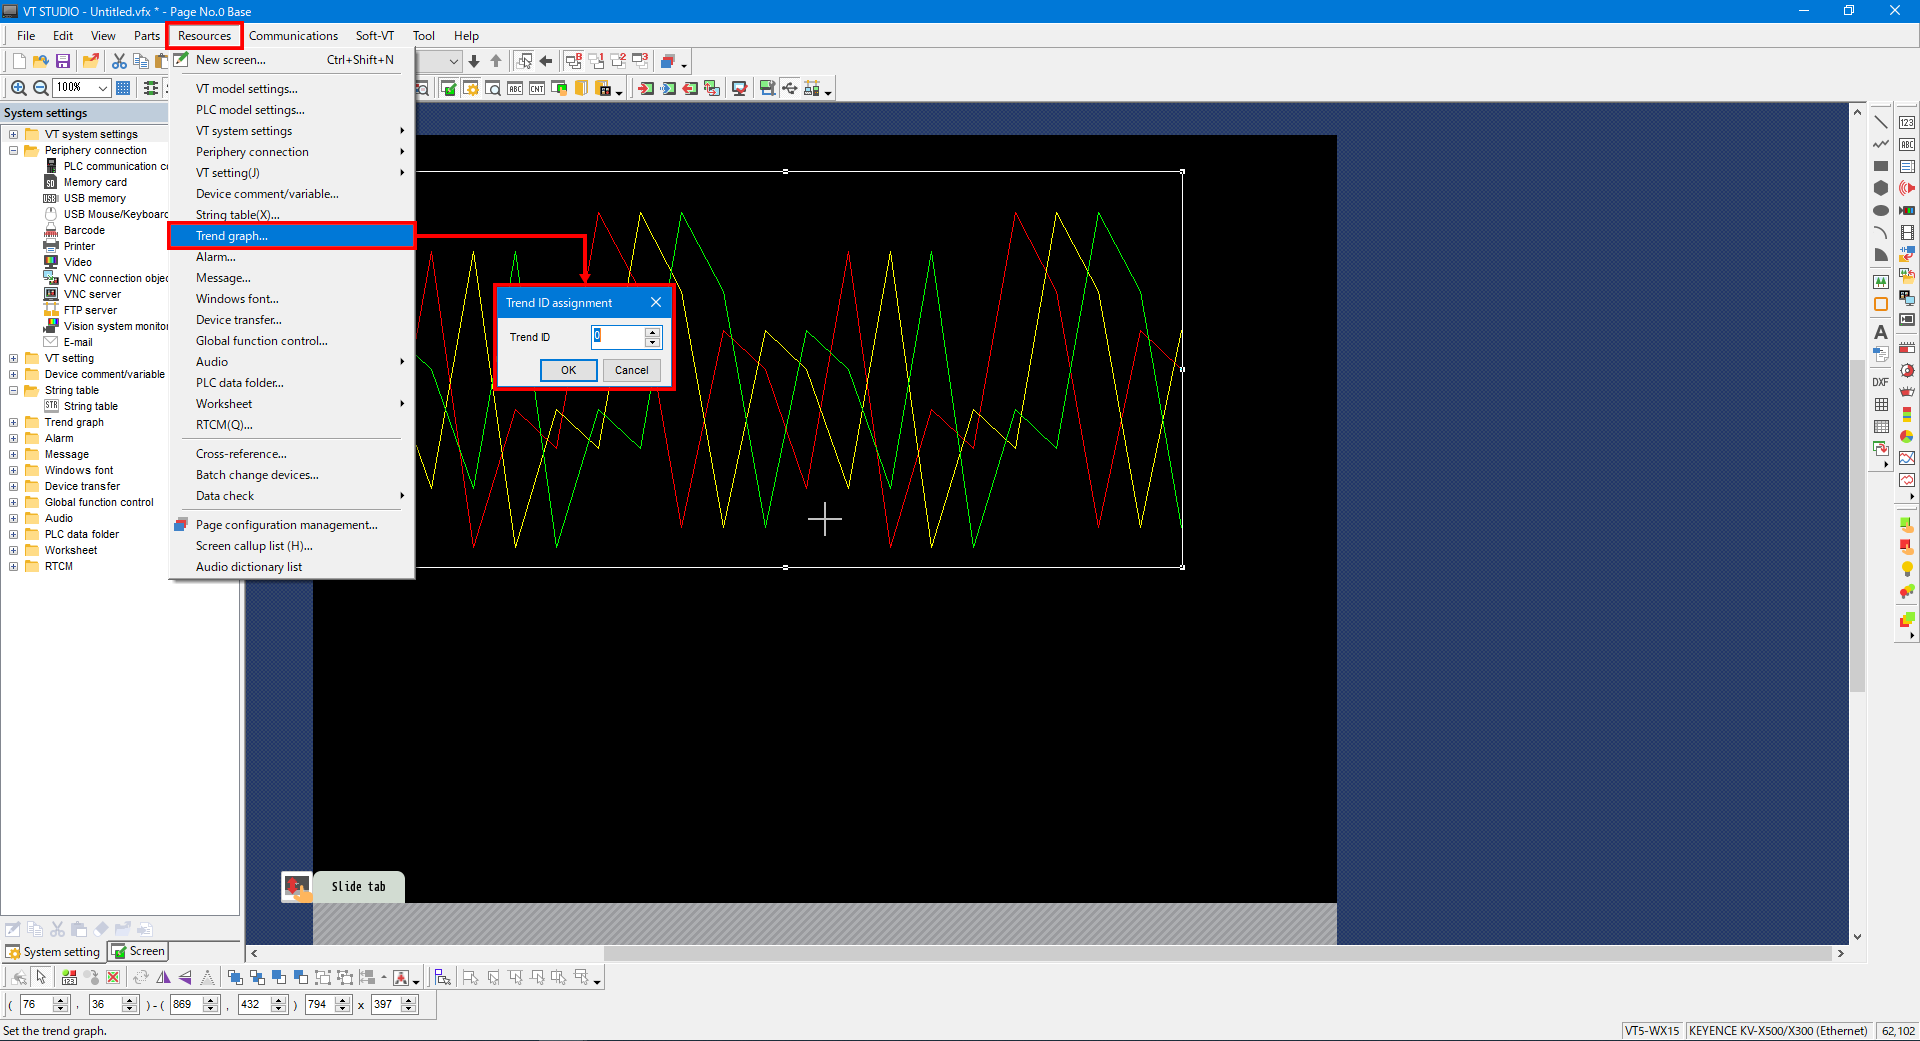
6. Set the number of trends and the trigger. By default, a continuous set of devices is set as the sampling target.
To sample non-continuous devices, set “Logging mode” to “Expanded (individual device specification).”